"How do you do capacity planning with Kanban?" - this has been a recurring question for us at Businessmap. That is why we decided to address this topic formally through this article.
When we get asked this question, it is usually one of these objectives/questions that people have:
- As a manager, I need to know if my projects are on time.
- As a manager, I want to know when a new project can be started.
- As a manager, I need to know if delayed work is on the critical path of my project.
- As a manager, I need to know how the delays of one task affect the following tasks and what the new overall picture is.
- As a manager, I need to be able to plan future projects based on the capacity of my teams.
To address the topic thoroughly, we need to answer each question separately.
As a Manager, I Need to Know if My Projects Are on Time.
This is one of the easier questions to address. If you are using the timelines in our project and portfolio management platform Businessmap (formerly Kanbanize), you can visualize and plan your projects accordingly.
As soon as the project is started, the software will show you a red-yellow-green status. The image below shows a project that is 80% done but based on the plan, it should have been 89% done. (I.e. it's being delayed by 9%.)
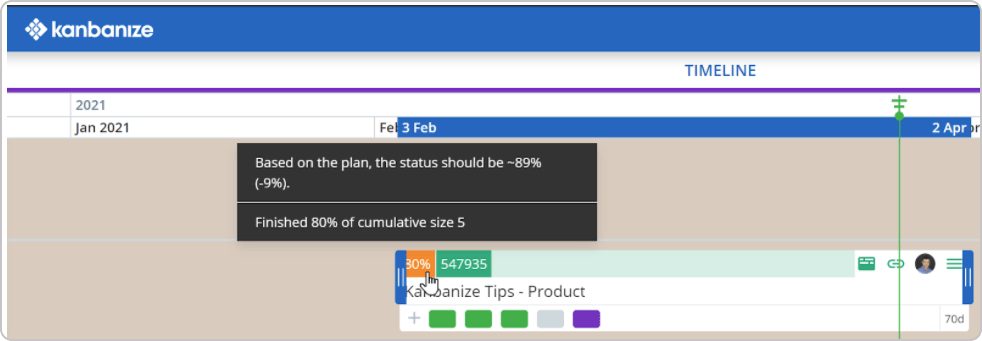 Tracking project completion on a Kanban board in Businessmap
This way of status tracking is not 100% accurate, as the state of the cards is binary (finished / non-finished). This means that a card may be 99% complete, but the system will treat it as 0% complete. However, if your work is flowing through the workflows fast, it will be a good enough approximation most of the time.
You can determine if a project is on time, even if you are not using the timelines. Each initiative in Businessmap has a built-in Forecasting tab, which shows four different scenarios about the expected end date. If some of the forecasts exceed your deadline, the bars on the chart are colored in red, indicating that your project will be delayed if that scenario materializes.
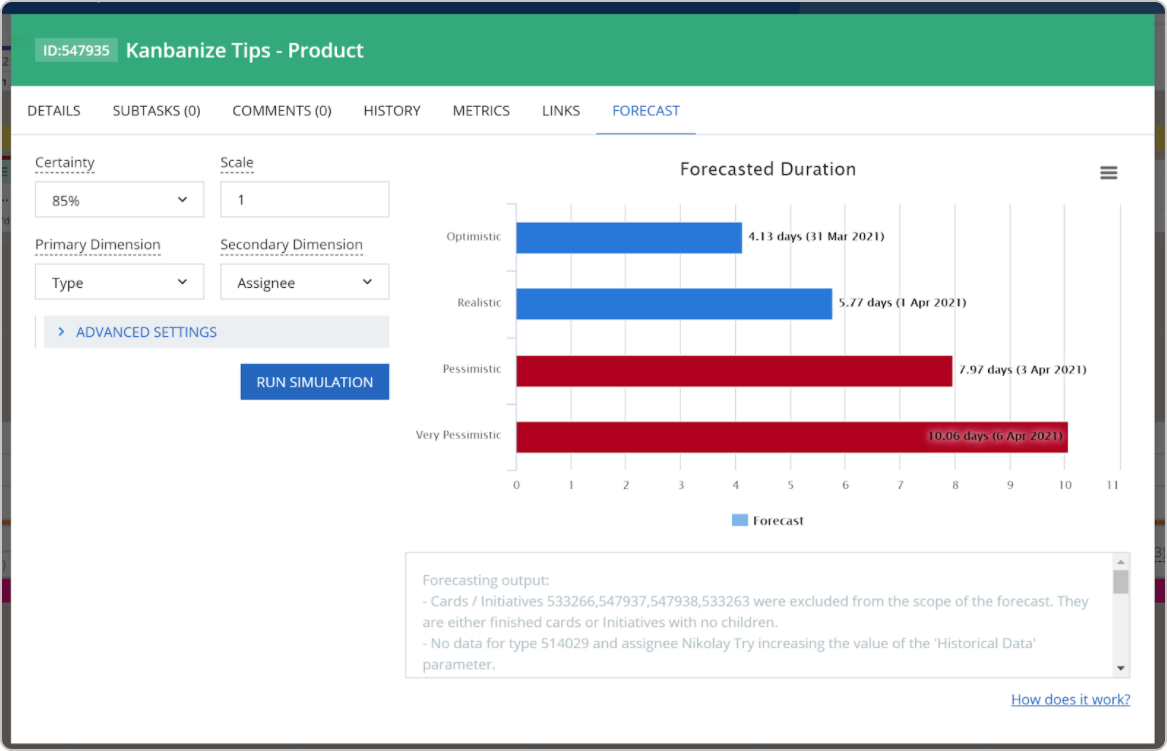 Forecasting project duration using the Forecast feature
Simply put, if there's red on this chart, your project might be late. How these forecasts work is a topic outside the scope of this article, please refer to the Businessmap Knowledge Base for more information on the subject.
It's still worth mentioning one thing - the forecasts in Businessmap are based on actual data and not on someone's judgment. This makes them inherently resistant to personal biases and much more accurate than assessments by a given individual.
As a Manager, I Want to Know When a New Project Can Be Started.
The answer to this question is very similar to the previous one. There's just one detail - do all people work on the same set of projects, or do you assign people to projects as and when necessary.
If all people work on the same project, use the previous approach to determine the earliest possible date when a project will get finished. Once a project is finished, you should be able to start a new one.
In case you need a specific group of people to open a new project, the approach is a bit different. First, determine how many work items are assigned to these people and therefore have to be finished before they can start working on something new.
To do so, you can run a search in the software with the following criteria:
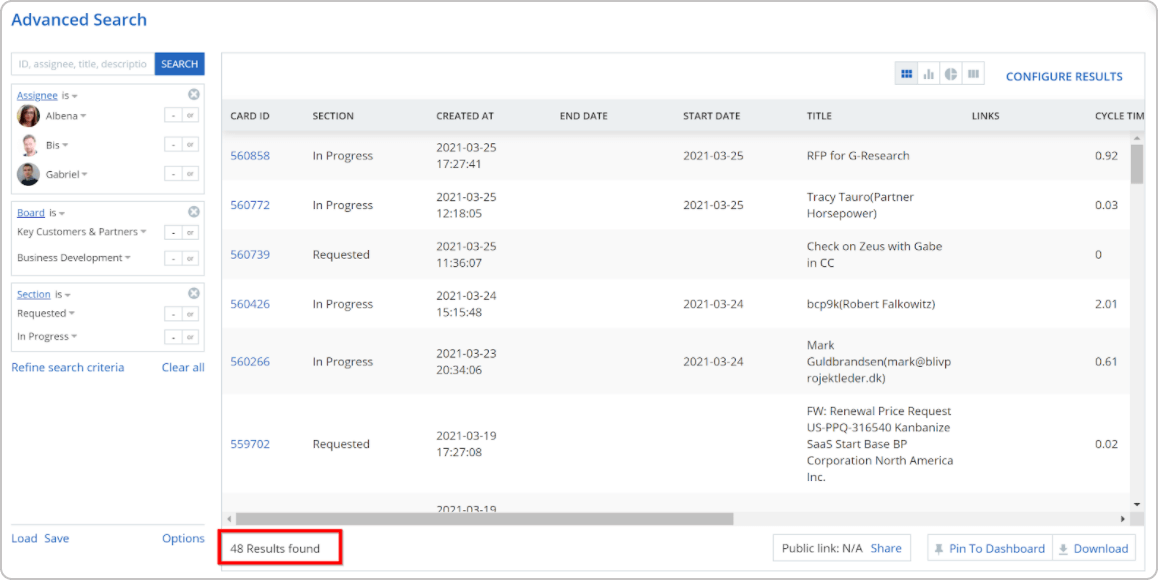 Applying advanced search to identify if certain team members have available capacity
Under Assignee, you list the people you need on the new project.
The Section is set to "Requested" or "In Progress", which searches for cards that have not been finished. You can also add "Backlog", if you want to include the unfinished cards there.
In the example listed above, we see 48 unfinished work items (the number at the bottom). With this data, we can use the Monte Carlo simulation widgets in Businessmap to determine when these 48 work items may be finished.
First, add the Monte Carlo When widget to your dashboard and configure the settings to be like this:
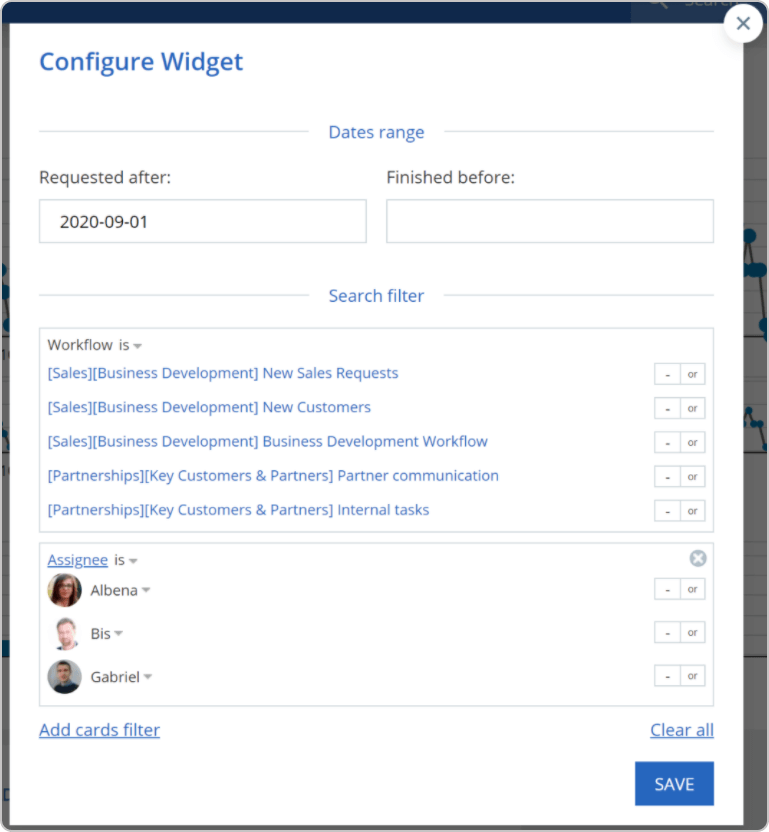 Configuring Monte Carlo widget in Businessmap
The settings of the widget have to be the same as the settings of the search above. Just make sure to set the "Requested after" date to a date far enough in the past so that the system collects sufficient historical data. If you see no data or if the information doesn't make sense, try increasing the interval.
When the widget shows up, you can enter the number of cards you want to forecast (48):
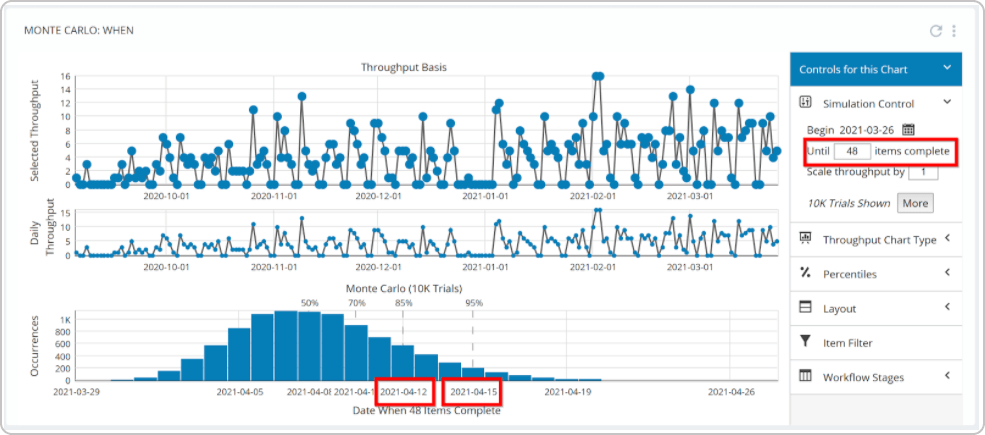 Monte Carlo simulation to determine possible work items completion dates
Once you enter the number of cards, the Monte Carlo simulation will show you possible dates when these 48 cards will be finished. Please note that each forecast has attached probability to it (50%, 70%, 85%, 95%, etc.).
As a Manager, I Need to Know if Delayed Work Is on the Critical Path of My Project.
Businessmap does not support Critical Path Project Management out of the box, but it's quite easy to implement this idea using the timeline workflow.
The timeline workflow is built out of rows which we call "tracks". The initiatives that you plan on the same track have an implicit predecessor/successor relationship. This means that your team cannot start Initiative B unless A has been finished first.
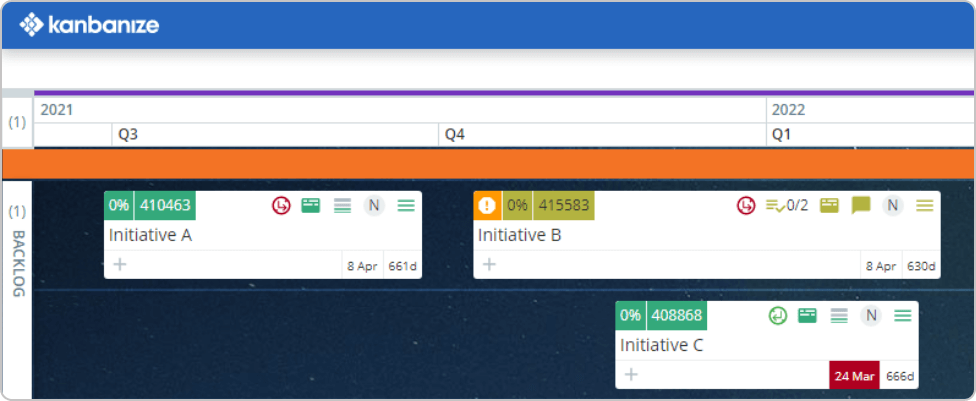 Initiatives with predecessor/successor relationship on a Timeline Workflow in Businessmap
Because of this implicit relationship, the track that goes farthest to the right represents the project's critical path. Please note that this statement assumes no buffers between the separate initiatives on this track.
In the example below, we have a very simple timeline with only two tracks. The last initiative in the first track (Initiative B) is supposed to finish in Q1 2022, and that's the end date of the entire project, as the first track actually represents the critical path.
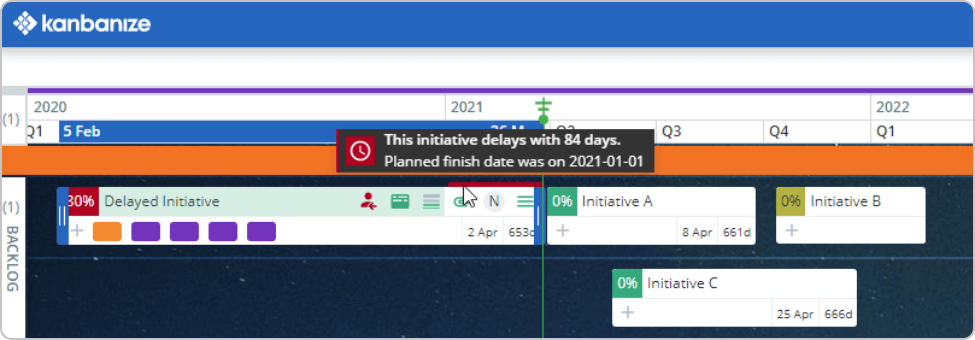 Delayed initiative completion on a Timeline Workflow
However, we see that the left-most initiative is delayed by 84 days. As this is our critical path, this means that we need to push all initiatives 84 days to the right, which will be our actual project end date. If you do so, the picture changes into this:
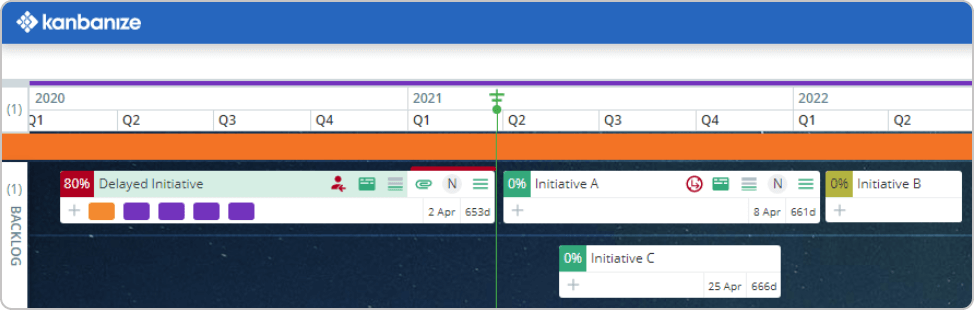 Visualizing all project initiatives on a Timeline Workflow
In summary, any delay of an initiative inside the "critical track" should lead to an adjustment of all other initiatives to the right.
As a Manager, I Need to Know How the Delays of One Task Affect the Following Tasks and What Is the New Overall Picture.
This is a tough one. The challenge in answering this question is related to the fact that Kanban does not encourage scheduling individual work items. Having strict start and end dates for some work items is okayish, but if you put these on all work items, you may not be doing Kanban at all.
As far as we are concerned, scheduling all individual work items with start and end dates is an anti-pattern, and you should consider abandoning that practice.
Kanban is a pull system that schedules work based on the available capacity and not on dates. Even if you planned to start Task A today, you shouldn't do it if there's no capacity. In that sense, scheduling work in Kanban simply means sequencing the work from most to least important and asking your teams to take the top one when they are available to start new work. This gives you flexibility and an opportunity to adapt to an environment experiencing frequent changes.
Here's why.
Each Kanban system has a certain level of Work In Progress (WIP) that brings optimal throughput and Cycle Time. To clarify what this optimal WIP is, let's look into Little's law, which states that the average cycle time of a system equals the average WIP divided by the average throughput.
Average Cycle Time = Average WIP / Average Throughput
In other words, if we have a fixed throughput of X, reducing the WIP is going to reduce the cycle time too. That's a big deal in Kanban and a lot of the cycle time improvement comes from here.
If we focus the equation on Throughput, it will look like this:
Average Throughput = Average WIP / Average Cycle Time
So, both Cycle Time and Throughput depend on WIP, and the relationship is proportional. The lower the WIP, the lower the Cycle Time (good) but also, the lower the WIP, the lower the throughput (happens below certain WIP, and it's obviously bad).
All this means that big WIP leads to huge cycle times and small WIP (beyond a certain point) leads to lower throughput. There is a value of the WIP that balances the other two values so that the Kanban system produces optimal throughput without hurting cycle times too much. This is what the WIP limit of the system should be.
Let's assume a Kanban system has an optimal WIP limit of 10 work items. This means that, at any point in time, the number of work items in progress shall not exceed this number, nor shall it deviate too much from it. Only then will the system produce the optimal results that we want.
And here's the contradiction that arises out of fixed-date scheduling. You may think you have a free WIP limit on date X, but the capacity might not be there due to variability in the process. Actually, it is highly unlikely that you consistently guess when a task is going to start/finish, even if you are a very experienced project manager.
It can be argued that if you plan the tasks using a timeline and limit the number of tracks, you are actually limiting the WIP. This is true. However, it doesn't change the fact that you will risk worse quality, as teams will feel pressed to start work based on schedule and not exit criteria. Besides, you will have to update the plan regularly, which has no real benefit and is rather pointless.
But what can you do if you must know how the project is going? Well, we already answered that in the previous sections. It is totally fine to schedule bigger pieces of work (Initiatives) and manage them, instead of the individual work items. As a manager, this is where you should be focusing your attention while leaving the individual work items to the teams to deal with.
Just some heads up: You should use a WIP limit for the initiatives too ;).
As a Manager, I Need to Be Able to Plan Future Projects, Based on the Capacity of My Teams. I Usually Do this When I Assign Work to People and Distribute Days/Hours.
We're arriving at the last topic, which happens to be the most popular one across our user base. To address this challenge, we recommend a probabilistic approach to planning, which differs from the traditional approach using Gantt charts.
Planning a Project Based on Historical Data
If you have some historical data, planning a project boils down to creating the work items and linking them to an initiative representing the project. If you do so, Businessmap will show you a forecast right away.
This sounds easy, but it's never that easy, isn't it? It is likely that the forecast looks unrealistic without some proper tuning. Pay attention to the "Scale" parameter, which encompasses key assumptions about the underlying work (complexity and parallelism).
Also, make sure you state your assumptions about the minimum and maximum cycle time for the individual work items.
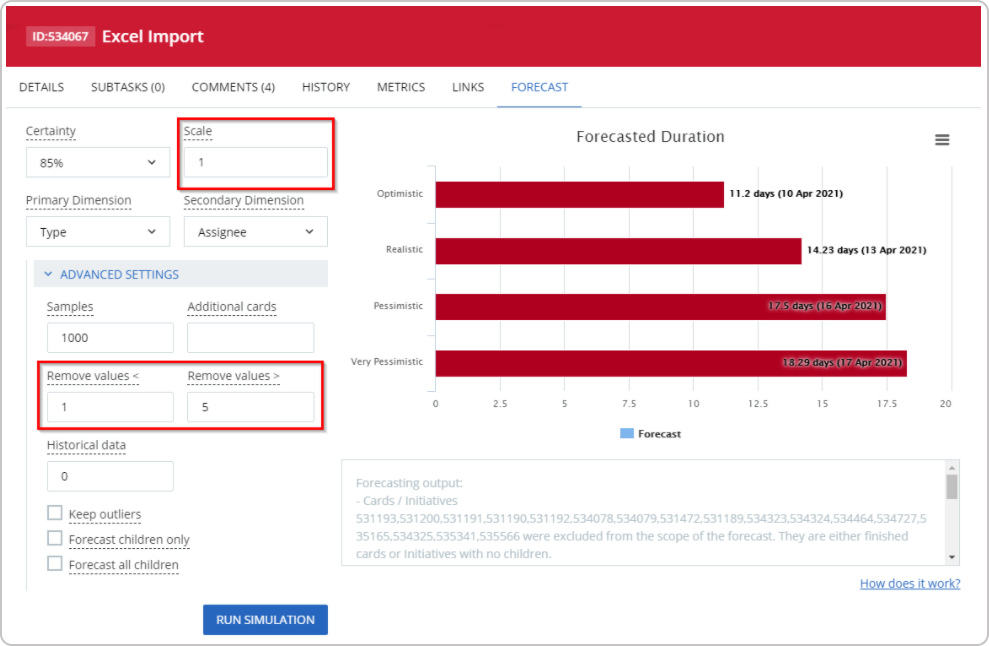 Forecasting project duration based on work complexity and parallelism
To learn more about these parameters, please check the knowledge base.
If you don't want to create the entire project breakdown, or if you can't do it for some reason, you can use a simplified approach to planning the project. This is possible using the "Additional cards" parameter.
Use this parameter if you want to create a forecast that accounts for X more cards that will be added to the scope at a later stage or if you want to extrapolate from a sample.
For example, if you expect a project to have 2000 work items that will be split between 50 people* in some ratio, create 10% of the cards while keeping that same ratio, then add the number 1800 in that field, so that the forecast accounts for the additional scope.
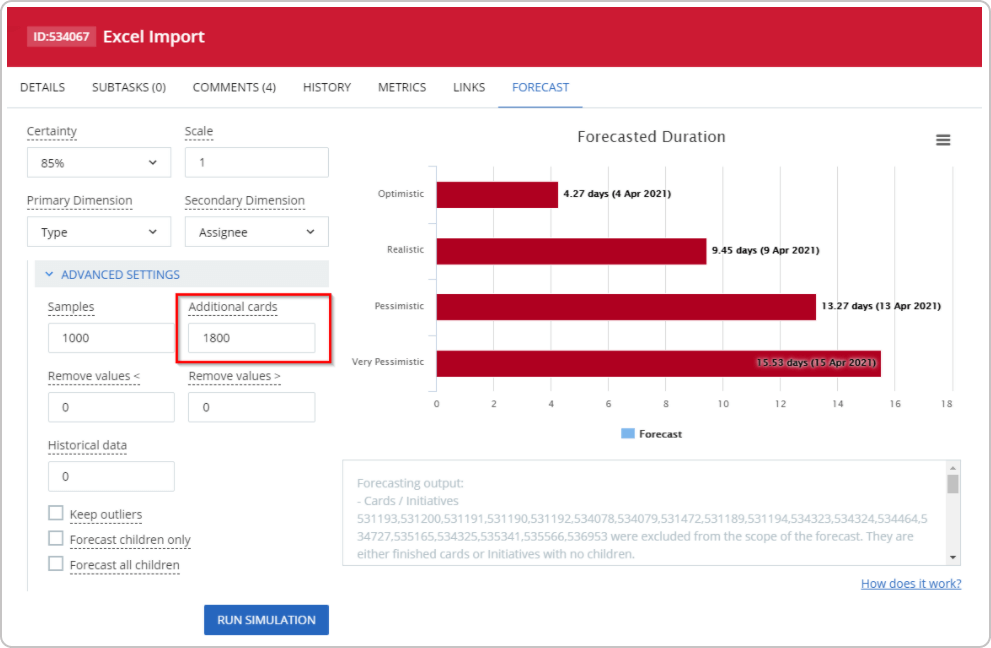 Forecasting project duration based on additional scope
*The ratio is derived based on the parameters Primary Dimension and Secondary Dimension. If you've selected a pair "type-assignee", then the forecast will expect that the ratio of types and assignees in the entire scope is the same as in the existing data set.
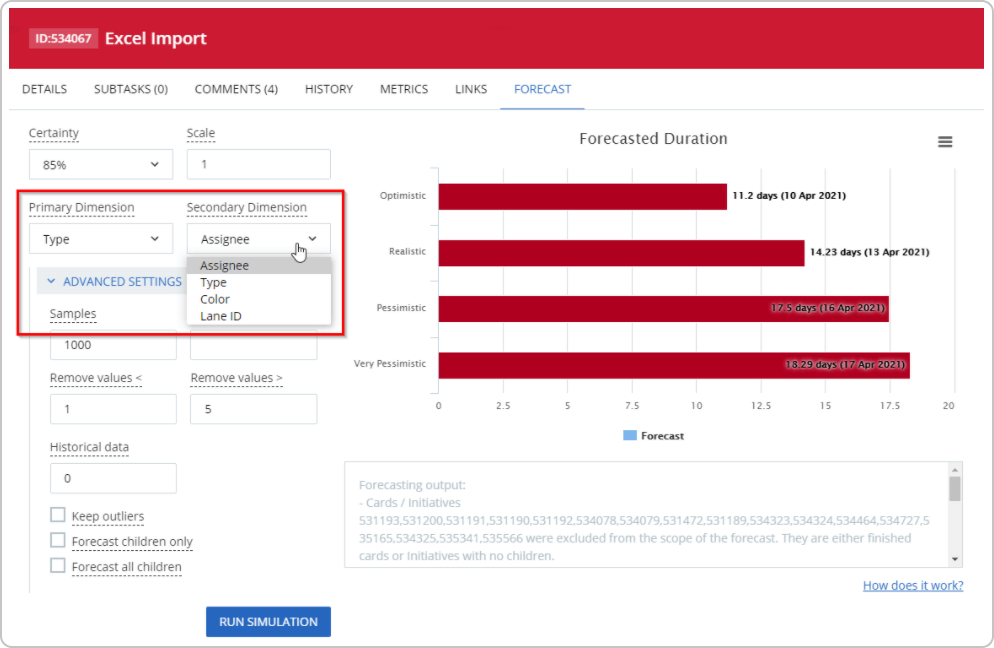 Forecasting project duration based on work type and assignee
Using the techniques above, you can estimate and plan a whole project, no matter how big the scope is. We recommend tracking the project on an ongoing basis, using the same forecasting facility, so that you spot any deviations early in the process.
Tip: If you don't want to create the work on the real team boards, you can use a new board. First, create the board, then import historical data using Excel Import. After you've imported the historical data, add the work items for the project and repeat the procedure described above.
Planning a Project Without Historical Data
This is a more challenging task, but not impossible. It is more challenging because you have no other choice but to estimate the individual work items and plan the project accordingly. If this is what you need to do, we recommend using the Critical Chain Project Management approach.
The CCPM approach is outside the scope of this article, but the main ideas are:
- Estimate all work items with a best-case duration and a more realistic duration.
- Assign the work items to the people as you'd imagine the actual execution to take place.
- The longest sequence of work items that lead from beginning to end of the project represents the critical chain.
- Take all deltas (realistic duration - best-case duration) and add them to the end of the critical chain as a buffer.
- Monitor and manage the buffer as work items are being finished.
Utilizing the CCPM approach over traditional critical path planning helps you avoid time losses caused by Parkinson's law or the Student syndrome.
As we recommended at the very beginning of the article, planning and estimating the project can be done using a model but it's not necessary to manage the project using that same model. The same applies to the CCPM approach.
Once you plan the project, you can use Kanban for the execution, besides tracking the project buffers. If you do so, you will be able to use the forecasting techniques listed above as soon as you have around 30 completed work items. This can help you detect deviations from the planned end date of the projects very early in the cycle.
Important Note
The forecasting methods described in this article have been proven to be very accurate and statistically valid. However, they depend on your data and your understanding of the underlying processes. If your processes are not consistent and predictable, the forecasts shall be used with caution. We recommend you always run sanity checks over the forecasts and compare them with your own expectations.
In case you see huge deviations, you should dig deeper and understand why the big difference exists. It's an opportunity to learn more about your process and you should use it.

Dimitar Karaivanov
CEO and Co-founder of Businessmap
Dimitar is a lean thinker and a Kanban practitioner with a solid background in the areas of software development and process improvement. He is passionate about achieving extreme performance at scale and applying Lean/Agile principles outside IT.