2020 was tough for all of us. But one thing we believe in is continuous improvement. Our slogan states it quite strongly: There is always a better way!
In the past months, despite all else, we decided to focus on delivering even better visibility and helping you further improve the connection between planning and execution. Especially in turbulent times like the current, knowing what is going on in your company, project, or team is vital for surviving the crisis and coming out of it stronger.
And the result is Kanbanize 8.0 with reimagined Dashboards as dedicated space for your widgets and custom reports. With this new format, you can build your business dashboard inside Kanbanize and centralize reporting on Portfolio, Project, and Team levels.
Kanbanize Dashboard Explained
Now you can separate your workspaces and Kanban boards from your reports to create widget-only dashboard, visualizing the most valuable and useful information.
This way, with custom report-centered Dashboard(s), you can:
- Display critical business metrics
- Gather reports in one place
- Focus on what matters to your team and organization
With the ability to combine Kanbanize Analytics charts, custom search reports, and external Power BI widgets in one place, you can assemble dashboards that meet your specific business needs.
With Kanbanize 8.0, you can also build multiple different dashboards, highlighting various aspects of your company, division, or project's performance. Displaying all critical business metrics in one place, you can share your dashboards with your colleagues and further strengthen alignment and transparency across the company.
Custom (Business) Dashboards Examples
Depending on your daily work, you want to build a custom dashboard that will give you the details and metrics you need. Let us show you examples of Team, Project, and Portfolio Dashboards.
Team Dashboard
Get a direct overview of how your team is doing by assembling a Team Dashboard. What this dashboard should include depends entirely on your specific KPIs for measuring team success and goal completion. However, we recommend adding a few widgets that will help you track critical matters such as:
- Project Status
- Team Performance
- Critical Work Items
As you see on the screenshot, the Initiatives in Progress widget will show you a complete overview of all your team initiatives, together with their completion rate and overall cycle time, directly on your dashboard. It not only visualizes the status of your team's projects but also gives you quick access to all initiatives child cards, so you don't need to switch tabs to collect relevant information regarding the different tasks.
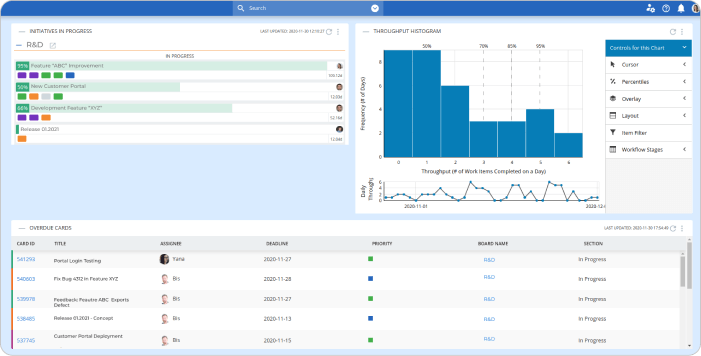
The Throughput Histogram can show you one aspect of your team's performance - how many work items they usually finish in one day. A drastic drop will signal that your team might be faced with a blocker or other workflow interruption and probably needs a helping hand.
Pinning the Overdue Cards Widget to your Dashboard will help you keep an eye on critical work items with overdue deadlines. Typically such tasks represent high project risks, and with this widget, you would quickly identify problematic matters without unnecessary searching and asking for updates. Knowing what's behind schedule allows you to focus the team's efforts (if necessary) on the most critical work at hand and reduce risks of overall project delay.
Project Performance Dashboard
Focus on project performance by building a dedicated dashboard to:
- Monitor project status
- Proactively manage project risks
- Keep an eye on relevant factors without wasting time on constant manual updates
Here custom advanced search widgets can be of great help. For example, for project status, you can filter all child cards of a particular parent initiative and visualize their status based on the board section. A simple pie chart will show you how many work items of the specific project are finished, how many are currently in progress, and if there are tasks still waiting in the requested area.
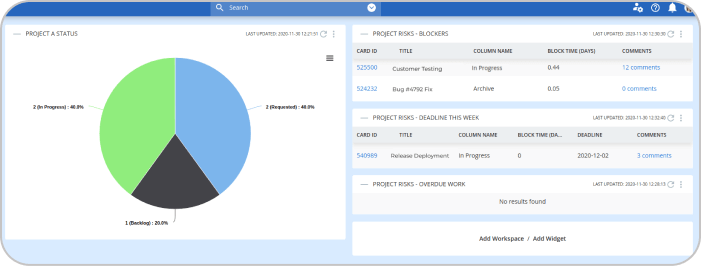
Filtering all child cards of a specific initiative with block time in another custom widget will help you identify project risks and take action if necessary. Displaying the cards' comments inside the widget could help you see project blockers and get up to speed with the details regarding the specific task, straight from your dashboard.
Two other custom widgets we think are useful to pin on your dashboard are related to project delays. On the one hand, you would like to keep an eye on work items with an upcoming deadline. Here you could assemble an advanced search, showing all child cards with the deadline "this week" that are still not in the board section "done". Getting a direct list of such tasks could help you proactively manage the risks of delays.
On the other hand, you should also monitor if there are child cards with overdue deadlines. Hopefully, this widget will always say "No results found", but it is advisable to add it to your Project Dashboard to ensure project success.
Project Portfolio Performance
Gain visibility in your project portfolio's performance by assembling a custom Dashboard that brings to the surface relevant metrics like:
- Process Efficiency
- Status of Multiple Projects
- Project Forecasts
- Capacity Allocation
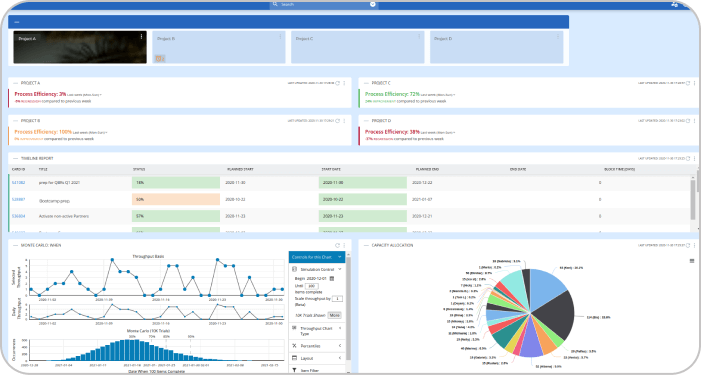
This Portfolio board highlights the process efficiency of the different projects and offers quick access to the workspace with the dedicated Project Boards.
The Timeline report widget shows a complete overview of all initiatives on the timelines of your Portfolio, together with their start and planned end dates. By marking the project status in red, orange, or green, the system also signals if it is moving forward as expected or running behind forecasts.
Knowing how many work items are in your pipeline and when you can expect to deliver them can help you communicate effectively with your stakeholders. A Monte Carlo widget could be an enormous help for project forecasting, allowing you to run calculations directly from your dashboard.
To keep an eye on the teams collaborating on the projects, you could also pin a custom widget here, visualizing the work distribution across team members. This way, you could identify and prevent overburdening or multitasking, or unhide free capacity.
All mentioned here just scratches the surface of the new Dashboard functionality. If you want to dive deeper into dashboard customization options, you can visit our dedicated knowledge base article. To get a better understanding of its various applications, assemble your first widgets-only dashboard now.

Nikolay Tsonev
Product Marketing | PMI Agile | SAFe Agilist certified
Nick is passionate about product marketing and business development and is a subject matter expert at Businessmap. With expertise in OKRs, strategy execution, Agile, and Kanban, he continues to drive his interest in continuous improvement. Nick is a PMI Agile and SAFe Agilist certified practitioner.