Flowcharts stand as a testament to the power of visual tools in simplifying complex processes across business, technology, and education. Their effectiveness is rooted in fascinating research from MIT, which revealed that the human brain can process images in as little as 13 milliseconds. This insight highlights the unparalleled efficiency of visual aids in enhancing our understanding and analysis of information.
In this blog, we'll explore the essence of flowcharts and their practical applications in making processes more understandable and efficient.
What Is a Flowchart?
A flowchart is a type of diagram used to represent a process or a workflow. Process flowcharts, or flow process charts, are visual representations of a step-by-step approach to arriving at a certain business outcome or solution to a given task. To illustrate the entire algorithmic process, the diagram employs various shapes and boxes describing attributes such as inputs/outputs, decisions, and comments, connected with a flowline showing the operation's progress.
An issue as simple as a non-working monitor can be illustrated using the flowchart diagram.
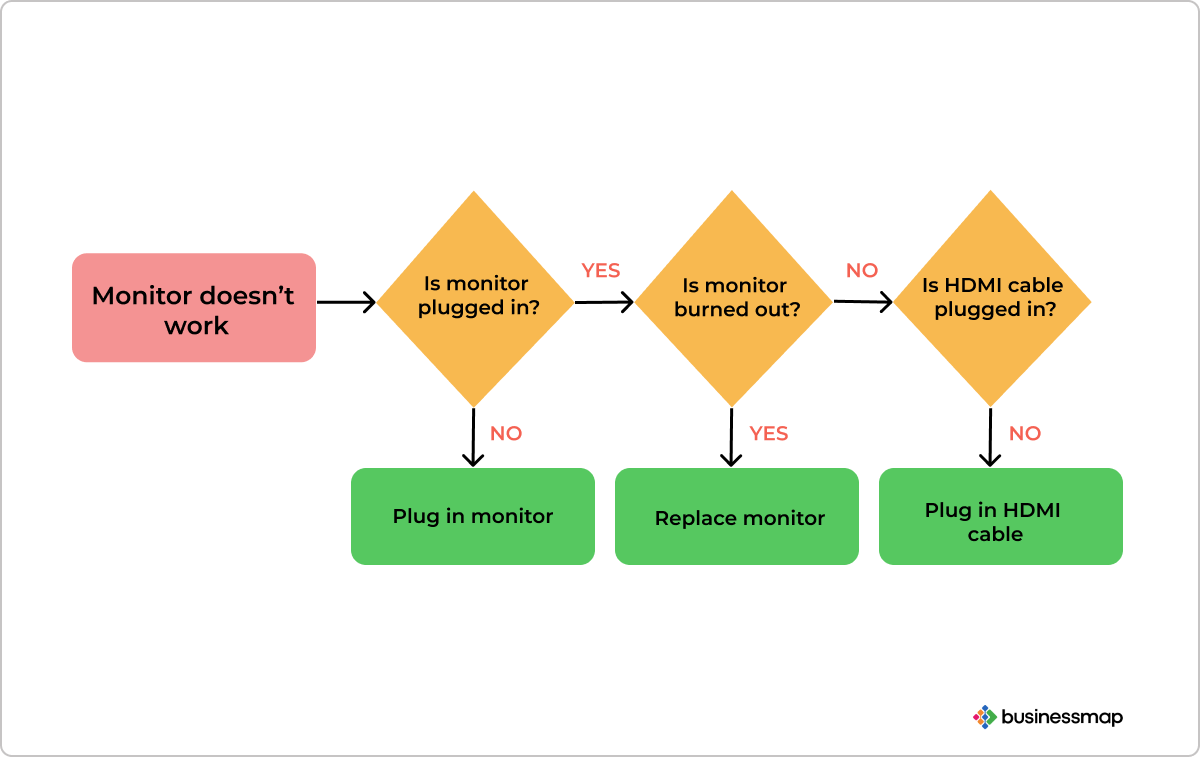 Flowchart representing a process for dealing with a non-functioning monitor
What Is the Purpose of Using Flowcharts?
Thanks to the simplified view of processes displayed using flowcharts, the model finds a wide application for:
- Clarification: Flowcharts turn complex processes into clear, digestible visuals.
- Communication: They assist in explaining the steps within a process to stakeholders.
- Analysis: You can identify inefficiencies and make improvements.
- Documentation: Flowcharts provide a reference for how processes should occur.
- Planning: You can map out new processes before implementation.
What Are the 10 Common Symbols of a Flowchart?
There are 10 most commonly used symbols in process flowcharts. They're listed below.
1. Terminator: The terminal or terminator flowchart symbol indicates the beginning or end of a process or a program. The oval rectangle normally contains a word or a phrase that signals either the start or end of the process.
2. Process: The process is represented in a flowchart diagram using a rectangle and indicates a set of operations or any processing function.
3. Document: A single document or report is represented using a rectangle with a wavy base.
4. Decision: Flowchart decision indicates a conditional state in the process with a minimum of two alternative paths for the program to proceed with. It is represented in a diamond shape.
5. On-Page Connector: The Flowchart's on-page connectors or references are represented by small circles labeled with a letter inside. They indicate where the flow makes a jump and continues somewhere else.
6. Input/Output Data: Input/Output in flowcharts indicates data entering the process (input) or resulting from it (output). The elements are represented using rhomboid shapes.
7. Comment/Note: The comment or note indicates additional information about a process step. It is represented using an open rectangle with a line connecting it to a given element in the process.
8. Off-Page Connector/Link: In flowcharts, an off-page connector or link indicates a target located on another page. The component is represented by a pentagon.
9. Flowline: A flowline indicates the sequence order in a process. In flowcharts, it is represented by an arrow.
10. Predefined Process: In flowcharts, a predefined process shows a process that is defined elsewhere. A rectangle with vertical edges represents it.
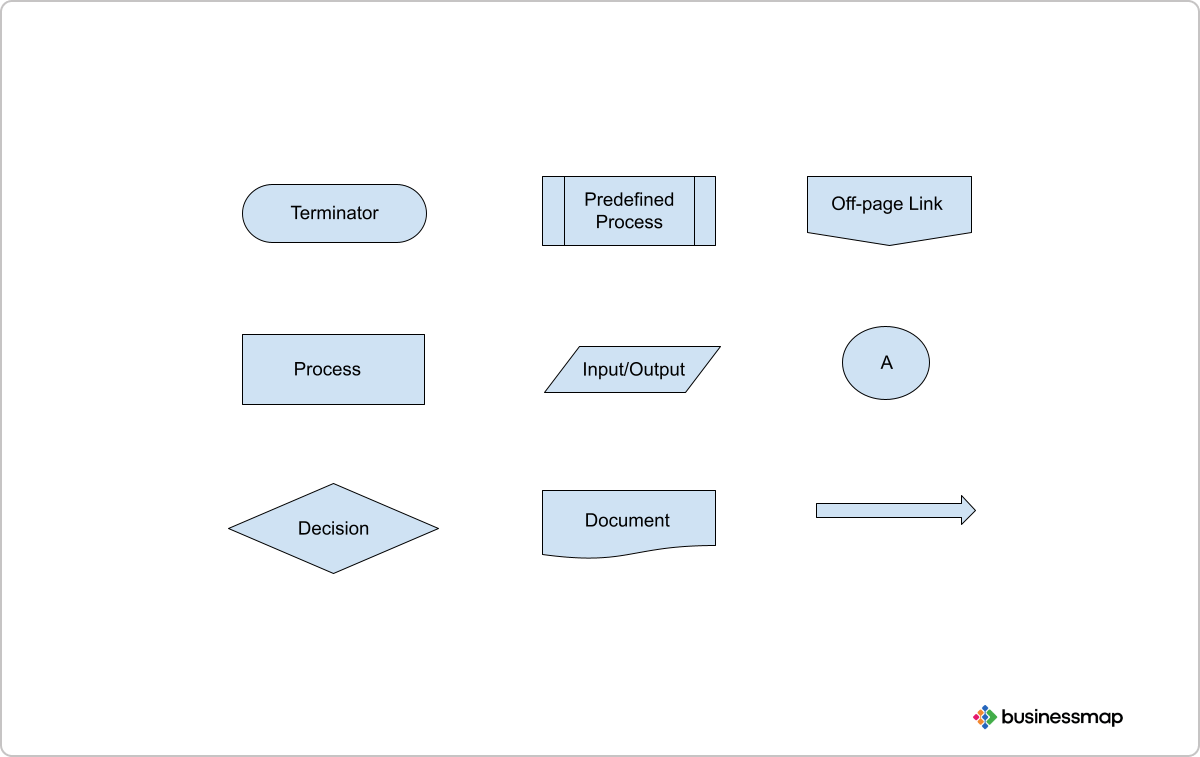 Flowchart elements
Common Types of Flowcharts
There are various classifications of flowchart methods depending on the application and user perspective. However, according to the ruling classification, there are four main types of flowcharts, and they differ depending on the user group and how control is applied. The four main types of flowcharts are document flowcharts, data flowcharts, system flowcharts, and program flowcharts.
Document Flowcharts
Document flowcharts illustrate the existing controls over document flow through a given system. They are read from left to right and describe the flow of documents through different business process steps. They help improve visibility and transparency in documenting a process and communication about how a process is done. Document flowcharts are widely used in various domains to document or study complex processes.
Data Flowcharts
Data flowcharts illustrate the existing controls over the flow of data in a given system. The model helps analyze a process or system by showing how information flows through it. The chart is successfully applied in software engineering, sales, or other business processes.
System Flowcharts
System flowcharts are visual representations of all the components in a system, including the inputs and outputs, processes, and decisions. Similar to the data flowcharts, system charts show how data flows through a system with the addition that system charts also include the decisions. The system diagrams employ a range of symbols to show all its building components. They are ideal for measurement and control in the engineering field.
Program Flowcharts
Program flowcharts are graphic representations of the existing controls in a program within a given system. They help explain how data is processed while writing a program and analyze the logic behind the code. The charts are applied in software programming to understand how users navigate through an application and further develop its structure based on these observations.
How to Build a Flowchart?
Creating a flowchart involves organizing your thoughts and constructing a visual representation of a process. It requires careful planning to ensure clarity and ease of understanding.
- Start with a clear purpose: Before you begin, know the objective of your flowchart. This ensures your design stays focused on facilitating understanding of the process.
- Use standard symbols: Familiarize yourself with standard flowchart symbols.
- Keep it readable: Use simple, concise language within the shapes. Avoid jargon or technical terms that might confuse the audience.
- Organize logically: Ensure your flowchart has a natural flow from left to right or top to bottom. Sequence steps should make sense and follow one another in the correct order.
- Consistency is key: Apply uniform shapes and lines throughout your flowchart. Consistent use of sizes and styles makes the chart easier to follow.
- Minimize crossing lines: To avoid clutter, aim for a flowchart with as few line crossovers as possible. This improves clarity and reduces confusion.
- Split complex processes: If your flowchart gets too intricate, break it down into smaller, manageable subprocesses. This can be done through linked charts or sub-charts.
- Validate your flowchart: Review your chart with others who are familiar with the process to ensure accuracy and utility. Feedback can highlight areas for improvement.
What Are the Benefits of a Flowchart?
The flowchart process analysis tool offers a handful of advantages that help increase the value of each operation or system. You can find a list of the most underlined benefits of flowcharts listed below.
- Improved Communication: Thanks to the ability to break down complex processes into their building components and represent them in a simple graphic way, flowcharts facilitate communication about how processes work. They can help to raise the alarm on impediments in the process or address improvement opportunities.
- Visual Transparency: Flowchart diagrams help clarify the exact sequence of steps in a given process and the functions and responsibilities assigned to each role. Flowchart processing also allows one to visualize the connection between multiple processes by creating linked diagrams.
- Comprehensive Documentation: Implementing flowcharts can help organizations promote unanimous processes throughout departments and teams. The simplicity of the charts makes them easy to understand and adopt at every level.
- Effective Analysis: The visual representation of all the steps comprising a process makes it easy to spot flaws. In flowchart diagrams, these bottlenecks are easy to identify and analyze, so you can take immediate corrective measures to remove all wasted steps and continue to improve.
- Sharing & Brainstorming: Using flowcharts and sharing unified visual representations of a process or a rising problem makes people more involved. Being on the same page encourages their participation in the analysis or brainstorming of new ideas and creates an environment of increased team and cross-departmental collaboration.
Common Uses of Flowcharts
Flowcharts offer a graphical representation for systematizing and analyzing different processes. Various fields find them indispensable for planning, documenting, and communication purposes.
Business Process Management
In business process management, flowcharts are used to map out the steps of complex processes within a company. They allow you to visualize work processes, improve workflow efficiency, and identify bottlenecks.
Key Applications:
- Process Design: Establish new business procedures.
- Process Analysis: Identify inefficiencies and redundancies.
- Communication: Share and explain processes with team members.
Software Development
For software development, flowcharts help articulate the logic before coding begins. They provide a clear framework for both technical and non-technical stakeholders to understand the algorithms and control flow.
Key Applications:
- Program Design: Outline the structure of programs.
- Debugging: Trace the path of algorithms when identifying issues.
- Documentation: Offer a visual summary of the code for future reference.
Educational Activities
Educators use flowcharts to teach and explain various concepts. They can display the steps in a process or the decision-making path in problem-solving activities, making it easier for you to grasp complicated subjects.
Key Applications:
- Instructional Design: Plan teaching methods and materials.
- Student Assessment: Evaluate understanding through flowchart creation.
Troubleshooting Guides
Flowcharts are essential in creating troubleshooting guides. They help you follow a systematic approach when analyzing root causes and resolving problems, particularly in technical fields.
Key Applications:
- Diagnostic Process: Present a step-by-step guide to find faults.
- Problem Resolution: Offer pathways to solutions based on the diagnosis.
Flowcharts are versatile and can be applied across various fields. Whether you're streamlining operations, solving problems, or designing systems, flowcharts are an essential tool that can enhance understanding and effectiveness.
Flowchart Examples
The following flowchart example shows the sequence of events in fixing a non-functioning desktop monitor.
Fixing Non-Functioning Monitor
| Terminator/Start | Desktop monitor doesn't work |
| Decision A | Monitor plugged in?/Yes |
| Process | If No/Plug-in monitor |
| Decision B | Monitor burned out?/No |
| Process | If Yes/Replace monitor |
| Decision C | HDMI cable plugged in?/No |
| Process | Plug-in HDMI cable |
| End | End |
Production Line Upgrade
The following flowchart example shows the sequence of events in executing a production line upgrade.
| Terminator/Start | Production line upgrade |
| Process | Assigning maintenance team |
| Process | Upgrade of current equipment |
| Process | Perform safety compliance check |
| Process | Testing upgrade |
| Process | Roll-out of upgrade on production |
| Process | Creating upgrade report |
| End | Production line upgrade complete |
Vacation Request Submission
The following flowchart example shows the sequence of events when submitting a vacation request.
| Terminator/Start | Vacation request |
| Process A | Submit the vacation request |
| Process B | Approval from manager |
| Decision | Vacation request approved |
| Process | Inform HR manager |
| End | End of the process |
Remember, an effective flowchart is a communication tool that should help any viewer understand a process at a glance. Keep your design user-friendly and functional.
Flowcharts Frequently Asked Questions (FAQs)
What Is the History of the Flowchart?
The flow process chart was the first approach to documenting the sequence of steps in a process. The Flow process chart model was first introduced by Frank and Lillian Gilbreth in 1921 in a presentation to the American Society of Mechanical Engineers (ASME). The model was initially adopted by the industrial engineering domain, although in the early 1930s, it was trained for business people as well. A pioneer in spreading the word outside the industrial field is Allan Mogensen, followed by his graduates Art Spinanger and Ben Graham. In 1947 ASME created their ASME Standard: Operation and Flow Process Charts based on the original flow process chart.
The flowcharts were also used to describe computer programs until the 1970s when programming languages became a powerful alternative for documenting computer algorithms. Flowchart diagrams are still used today in the field. Techniques such as UML activity diagrams or Drakon charts are considered to have originated from the flow process charts.
What Is Parallel Mode in Flowchart?
Parallel mode or parallel processing in a flowchart is a visual representation of two processes operating simultaneously. It is represented by drawing two horizontal lines at the start and end of the two processes. This mode allows you to demonstrate synchronization between two operations.
In software engineering, for instance, developing a user story and creating visual design can be easily visualized using a flowchart diagram to indicate the synchronous execution of the two processes. Another practical use of parallel processing is to show how several issues are being solved simultaneously.
What Are the Tools for Making Flowcharts?
The best tools for creating flowcharts offer a wide choice of templates, shapes, objects, and capabilities to export charts in various file formats, import data from other sources, and more. Some of the most prominent flowchart creation platforms include Microsoft Visio, SmartDraw, Lucidchart, Draw.io, and Gliffy.
What Is the Difference Between Process Mapping and Flowcharts?
The main differences distinguishing process mapping from flowchart diagrams are related to their roles - while the former is the process of describing a business operation in its entirety, the latter provides the visualization means to describe the operation model. The drawing itself is helpful to visually represent a process to upper management, highlight improvement opportunities, contribute to the global business goals, or analyze specific issues. At the same time, both aim at boosting organizations' efficiency. While process mapping comprises the entire business operation, as in a SIPOC diagram, flowcharts focus on improving efficiency by complementing it with a comprehensive visualization.

Iva Krasteva
Content Creator Expert | Agile Practitioner | Kanban Certified
With a background in Intellectual Property, SEO, content writing, and training in Lean, Agile, and Kanban, Iva is an enthusiastic Agile practitioner who embraces collaboration and flexibility every step of the way. Driven by constant learning and knowledge and fascinated by people's creativity.