What is flow efficiency?
What do you need to account for when calculating it? What is the average efficiency of teams across the globe? How can you measure it on a Kanban board with precision? What you are about to read will answer all of these questions and more, so that you can find out whether you really are efficient and where to focus your efforts to improve.
If you are new to Lean management and are yet to get a grip on the concept, you should take a minute to familiarize yourself with the Lean principles that are at the core of reaching maximum work process efficiency before continuing further with this article.
Work Efficiency Is Doing More with Less Effort
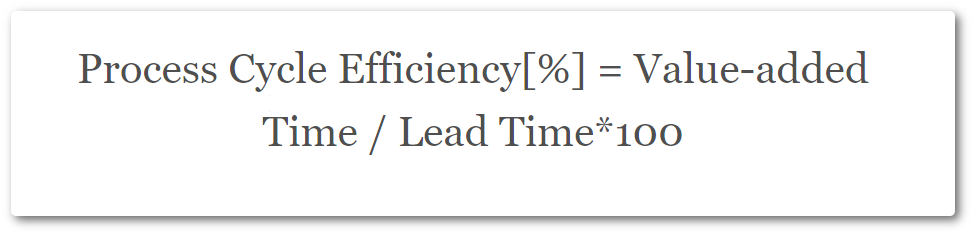
From the perspective of a Lean project manager, process efficiency can be calculated as the ratio between value-adding time and the lead time required to complete it. Let’s take a more detailed look at what that means:
- Value-adding time is the time frame in which your team or equipment actively works on a task;
- Lead time is the entire time that is required for an assignment to be completed;
- The difference between the two can be referred to as non-value-adding activities and should be minimized.
How to Measure Process Efficiency?
The most basic way to calculate process efficiency can be described by the following formula:
How to Increase Process Efficiency with Kanban?
The big problem that drives many project managers to the Kanban method is the fact that their teams are always extremely busy and yet meeting deadlines comes at the cost of a lot of stress and staying overtime at the office. Implementing a Kanban board is a good way to visualize the work of your team, but the board and cards themselves won’t be able to do anything for the fact that your efficiency is low.
The reason behind this is that the board merely serves as a tool to map your workflow. Establishing a flow is something that the team and their manager should do together by implementing explicit policies, automation, and rituals into the way they use their Kanban boards.
Among the most significant hurdles of a leader who has decided to apply the Lean project management approach is getting rid of the habit of multitasking that is widespread across organizations.
If each of your team members is working on a few tasks simultaneously (or is trying to), work efficiency can only go down. This is due to the fact that establishing a flow of work becomes impossible when you are constantly switching context.
It is up to the project manager to consider the appropriate WIP limits that should be placed on the Kanban board so that the team can keep their focus and avoid any unnecessary distractions.
In addition, upon identifying a bottleneck column that significantly drags down efficiency, you should consider placing an additional queue stage a few steps earlier or allocating additional capacity so that it can be alleviated a bit.
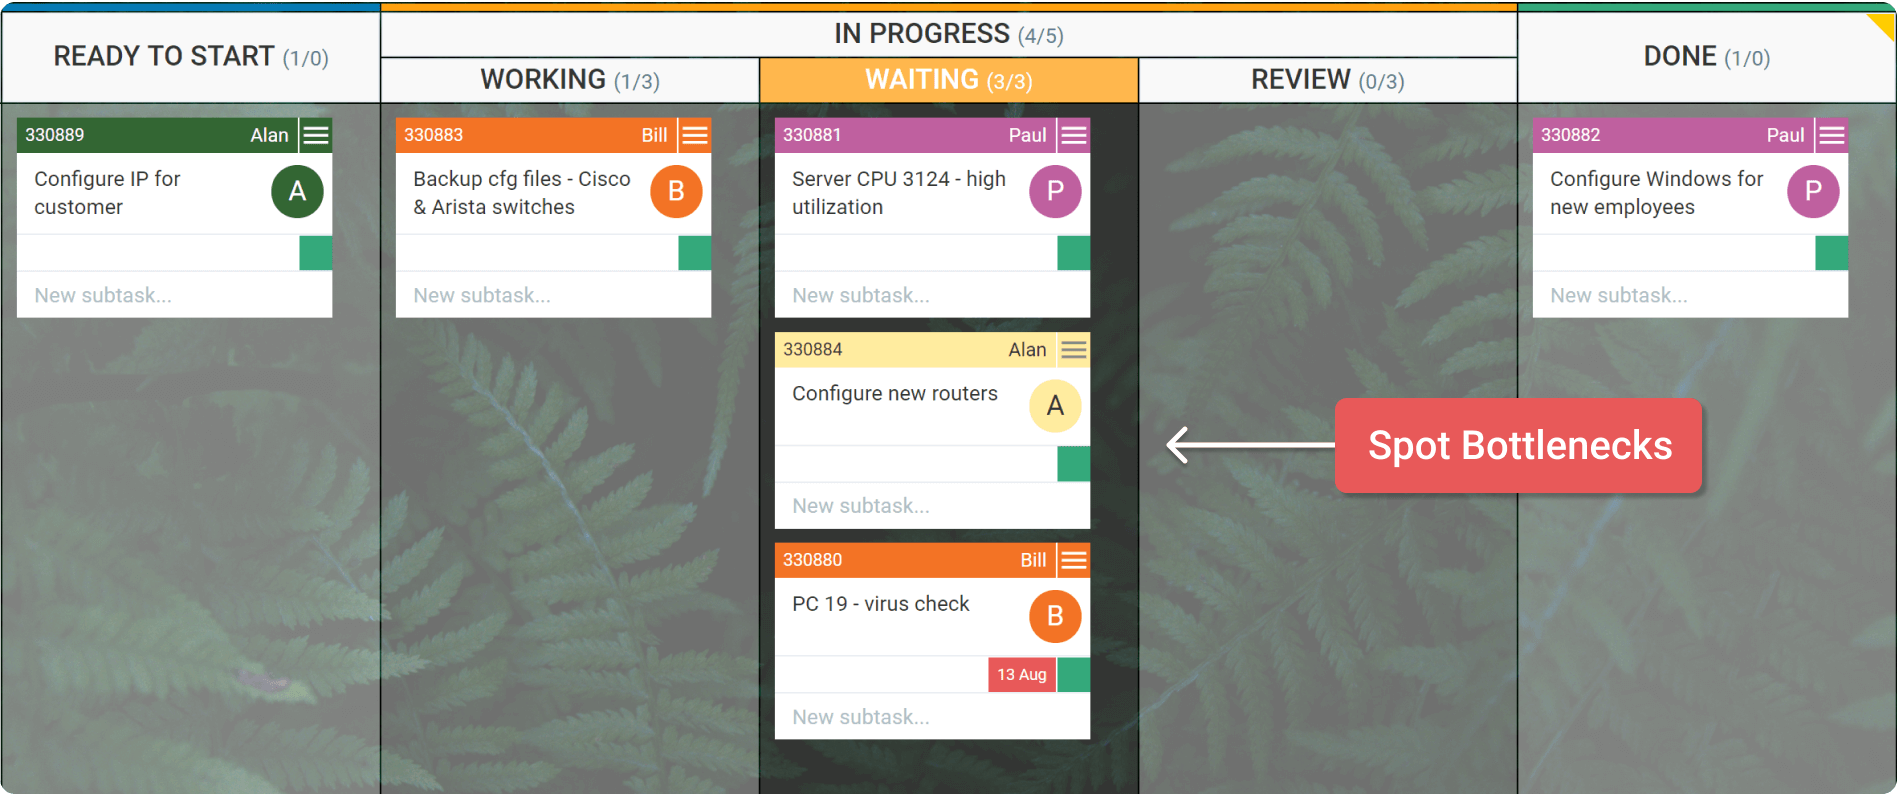
Process bottleneck on a Kanban board
What Is the Average Process Efficiency of Teams?
According to the author of Actionable Agile Metrics for Predictability Daniel Vacanti, the average flow efficiency of teams who are new to Lean project management or are generally not paying attention to their flow is between 5% and 15%.
Placed in a product development context, this means that if a user story takes 20 days to be completed and has a flow efficiency of 15%, then someone actively works on it for only three days. Therefore, during the other 17 days, the assignment stands idle in a queue column on a Kanban board somewhere in the system.
This observation is stated further by David J. Anderson who adapted the Kanban method for knowledge work implementation. In his experience, even more, adept teams that have reached symbiosis of their actions and are aiming to improve their flow have trouble surpassing 40% efficiency of their workflow.
Undoubtedly, this doesn’t sound like an optimally high number, but there are factors that drag down efficiency that are not always under the control of the project manager, such as:
- Dependencies - Dependencies on shared services, usually specialists or vendors. Dependencies on different teams or workflows working on dependent pieces of a system or within dependent elements of product architecture.
- Variation in the Nature of Work - As requirements vary, every piece of work is unique and the cycle times through individual stages of knowledge discovery will vary. As a result, some amount of queuing and a buffer are inevitable in order to achieve a smooth flow. The alternative is to have significant amounts of idle time for the team in order to absorb the variability in local cycle times.
- Team Liquidity (or lack of it) - In an environment of heterogeneous skills and experience, matching the right team member to a suitable piece of work means that more work must be in the system. The more heterogeneity in the team, the more WIP is required, hence, the more queuing time.
Considering everything that you’ve read by now, it should be clear that calculating flow efficiency is simple, but accounting for every factor that affects it takes time.
This is especially true when you’ve got a large number of assignments that pass through your flow. Fortunately, the digital age has provided us with ways to automate the process of calculating efficiency and we just need to filter the flow data of interest.
Meet the Flow Efficiency Chart!
A flow efficiency chart can be a game-changer for project managers who want to calculate the efficiency percent of their team precisely without having to spend tens of hours accounting for the efficiency of every single task that passes through their Kanban board manually.
As an item is moving through the phases of your process, it is essentially in one of two states:
- Actively being worked on
- Waiting
When it is waiting, it is either blocked or stuck in a queue column awaiting someone to put it in an active state.
A typical flow efficiency chart will calculate the ratio of the total amount of active time that a card spends being worked on to the total amount of cycle time that it took to get it done.
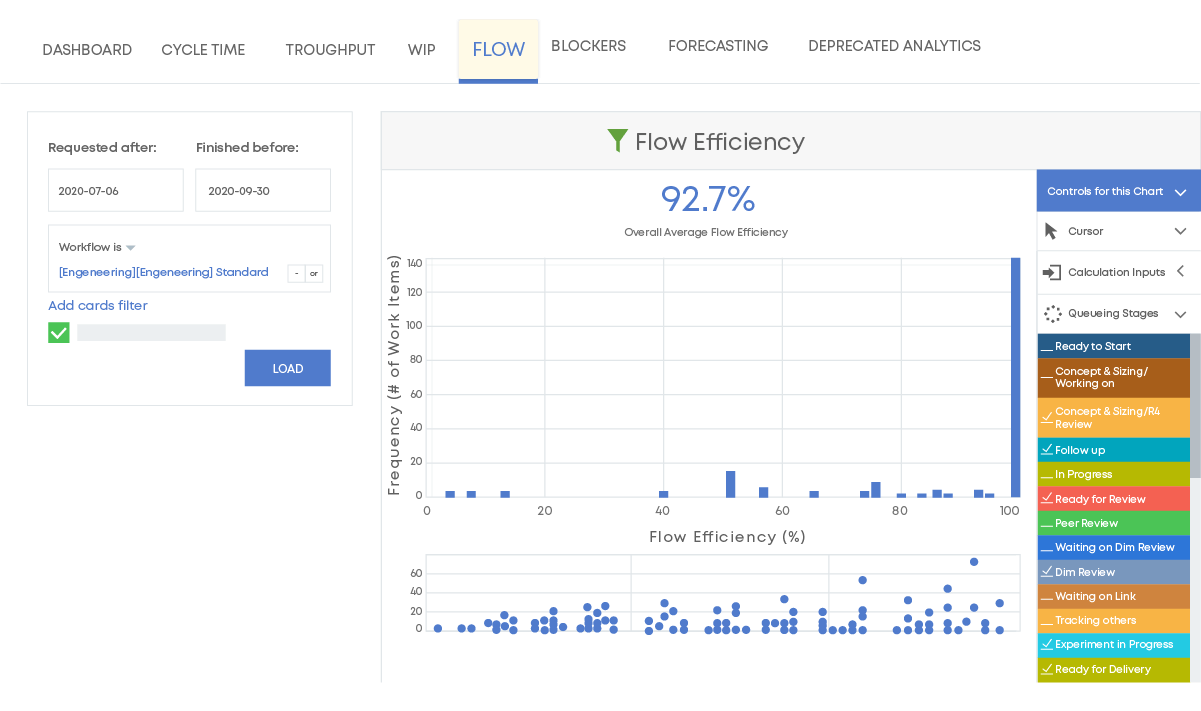
The chart will automatically gather data from every card that passed through your Kanban software board during a time frame of your choice, accumulate the overall flow efficiency for the period and visualize the results.
In order to focus on certain periods of your team’s work, you just need to select any time frame in the past. The main benefit of using a digital Kanban tool is that you can include and exclude additional factors such as blocked time of cards and do the same with different stages of your workflow in order to experiment and find ways to improve your performance in specific areas. In addition, this Kanban chart makes it a lot easier to present flow efficiency data to stakeholders.
The Flow Efficiency Chart can prove to be very useful when you:
- Want to calculate and visualize the efficiency of your workflow;
- Calculate how much a given bottleneck is dragging down your productivity;
- Calculate how long your tasks are spending actively being worked on vs waiting for someone to take action.
Measuring flow efficiency is a mandatory condition if you want to see whether you need to put serious effort into improving or are just a few little adjustments away from reaching process perfection.
Once you know how far along the path your team is, you should focus on decreasing the wait time of your process as much as possible before looking for a way to increase the active time that your team spends working on their tasks.
Experiment with different limits to the work in progress of your team and monitor how their efficiency changes and how the normal distribution of work changes. Be sure to adjust the stages of your workflow so that you can ensure the smooth movement of cards and attend to bottlenecks to keep them alleviated.

Alex Novkov
Content Lead
Energetic and practical, passionate about social media, creative writing, heavy weights, and outdoor activities.