The standard approach for communicating when customers should receive a given service/product has been to set commitments and promises based on estimations. However, in the volatile knowledge work environment, this frequently results in not delivering on time.
That's why in Kanban, we use Service Level Expectations (SLEs), and we are eager to share our first-hand experience from applying them in Businessmap - our project and portfolio management platform. In this post, we will discuss:
- What are SLEs?
- How to come up with your target SLE?
- Different scenarios for configuring and monitoring SLEs.
- What are the benefits of SLEs?
What Are Service Level Expectations (SLEs)?
In Kanban, SLEs can be defined as forecasts of cycle time targets for when a given service should be delivered to a customer (internal or external). In other words, Service Level Expectations represent the maximum agreed time that your work items should spend in a given process. The idea is to track whether your team is meeting their SLEs and continuously improve based on analyzing past cycle time data.
But first, let's discuss how you can use data to come up with your target team SLEs.
How to Probabilistically Derive Team SLEs?
Suppose that you want to forecast how long it would take for your team to process future customer requests.
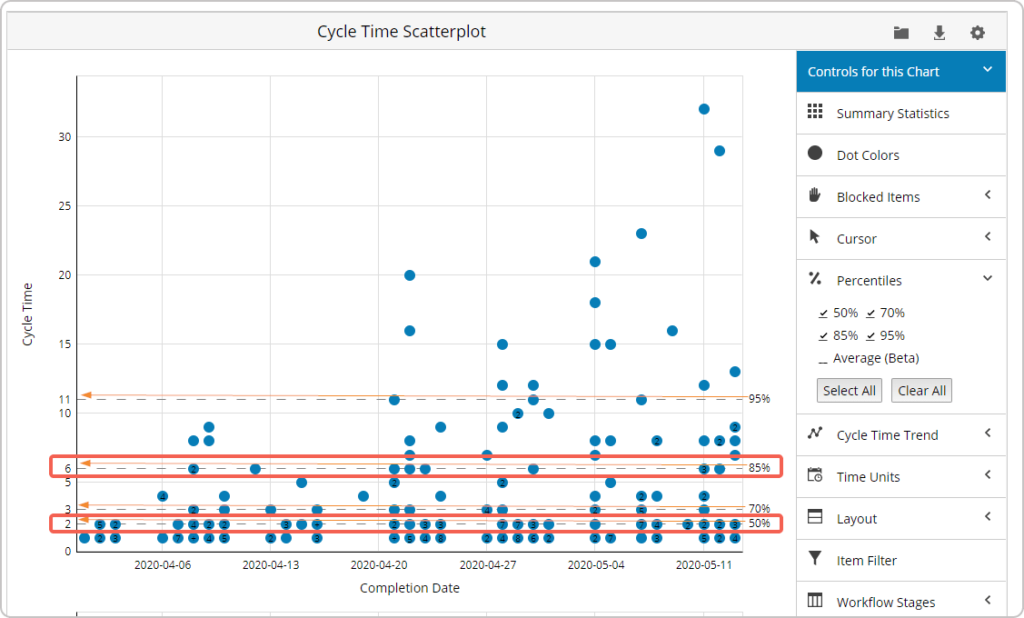
To do that, you can use a special chart called a "Cycle Time Scatterplot" which gives you an overview of your team's past performance in terms of completion times for work items. With its help, you can also visualize percentiles (50%, 70%, 85%, 95%) that represent possible delivery outcomes.
Taking a look at the sample Scatterplot chart below, you can conclude that your team can expect to complete future incoming requests within 6 days or less with 85% certainty. Another possible outcome is to finish future tasks within 2 days or less but only with 50% certainty.
Notice how we are not saying anything about commitments or promises? Exactly!
Those are the most likely delivery expectations based on a given set of historical cycle time data. Nevertheless, there will always be outliers. The important thing here is to use that data and lead communications within your team in order to agree on a level of certainty, not a specific delivery commitment. Therefore, if your chosen certainty level is 85%, then your SLE should be 6 days for that specific process.
But before we continue, don't forget that this number shouldn't be a "set and forget" SLE target. Refining it as changes occur (by monitoring the Scatterplot chart) is the basis of forecasting and Agile.
How to Enable Service Level Expectations on a Kanban board?
You might be thinking: "That's all great, but how do I know if I actually meet my SLEs?". This is where Businessmap steps in to help you track your delivery expectations directly on a Kanban board.
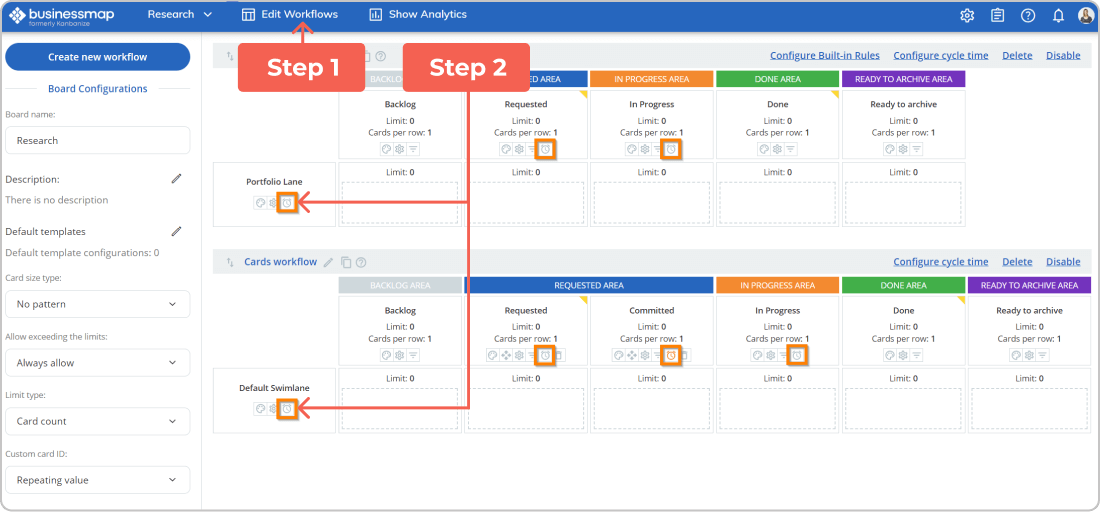
In the software, you can set SLEs per column (work stage), sub-column, swimlane, or cell on your Kanban board, or it can be a mix of those. All you have to do is access the workflow editor from your board and look for the clock-like icons there.
Let's explain how this works through some examples.
SLEs for Different Process Steps
Suppose that you are the project manager of a design engineering team, and you have different cycle time policies for the separate steps in your workflow (ex. CAD Design, Usability Assessment, and Design Modification). For example, you've agreed with your team that the cycle time of the "CAD Design" stage shouldn't go above 3 days, and you've set the respective SLE for that column on the board.
In this case, a progress bar will be visualized on every Kanban card that enters this process step.
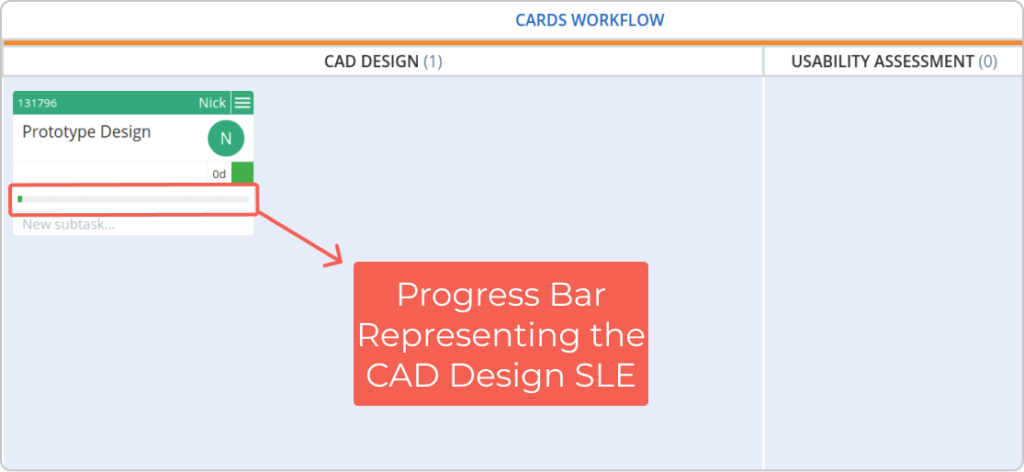
The bar will show you in real-time how you are tracking against your max SLE. If the work item (Kanban card) exceeds this cycle time threshold of 3 days, then a part of the progress bar will turn red, showing you how much the SLE has been surpassed.
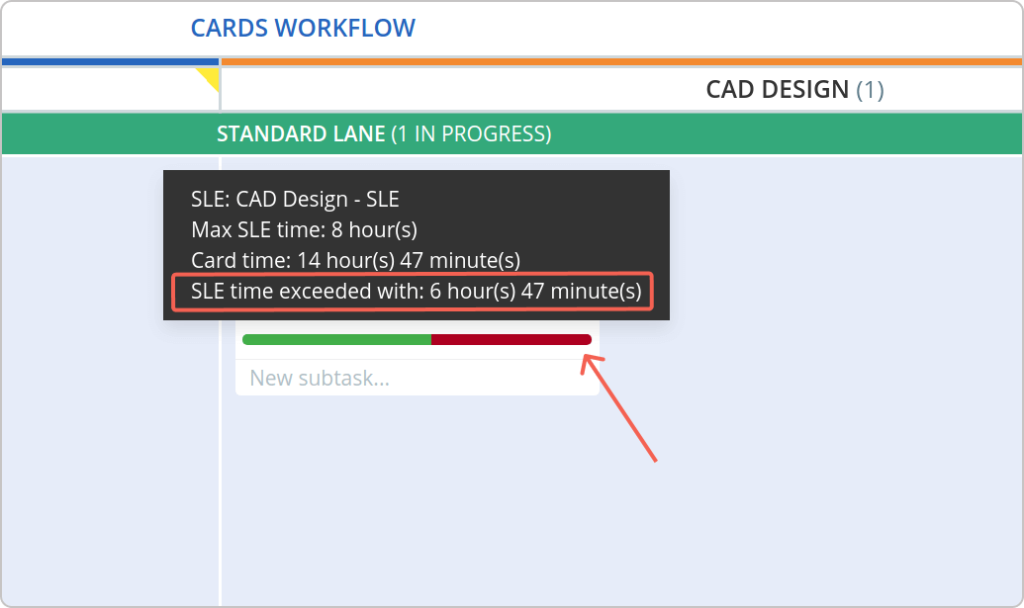
As a result, you will be able to see at a glance if the tasks in the "CAD Design" work stage comply with your chosen cycle time target. If they surpass it but stay there, the progress bar will keep growing redder, acting as a warning signal that you should investigate as soon as possible why those items remain stuck for a long time.
SLEs for the Entire Process
Now imagine another scenario.
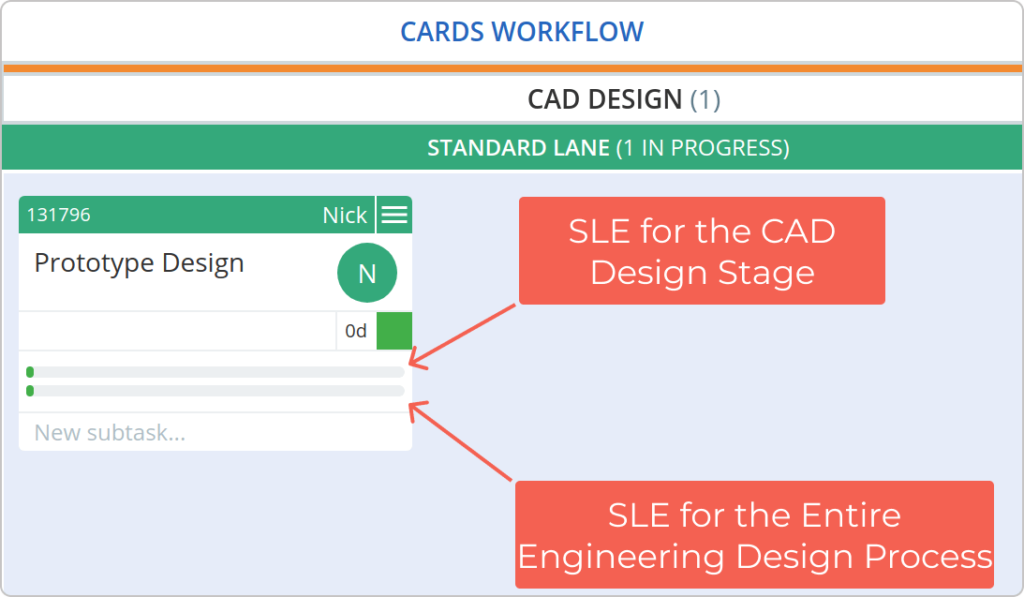
Apart from the delivery expectation of separate stages in your workflow, you've also negotiated an SLE of 6 days for the entire engineering design process. In fact, this is the most common scenario among teams because it allows you to measure whether you meet expectations of how fast you deliver work items from start to finish.
So, to track this on your Kanban board, you can set another SLE on a swimlane. In this case, whenever a work item goes to the "CAD Design" work stage, the system will visualize 2 progress bars on a Kanban card - one representing an SLE of 3 days for a column and another representing an SLE of 6 days for a swimlane.
Measuring the Full Lead Time
Here is a more complex scenario.
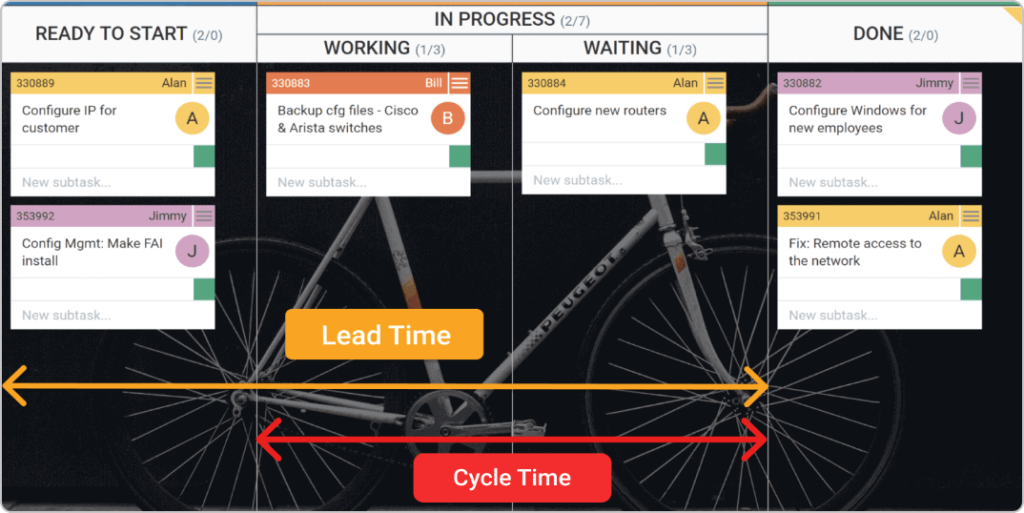
As you are probably aware, cycle time is the elapsed time between starting and finishing work on an item. Unlike cycle time, lead time represents the full time between a work item that has been committed (but not yet started) and delivered to the market. In Kanban, we say that a work item is committed once it enters the "Ready to Start" stage.
That being said, some teams are interested in extracting the whole lead time of their process as opposed to just the cycle time. Such examples are technical support teams as many of them want to track how long it takes them to close a ticket - from customer inquiry to issue resolution.
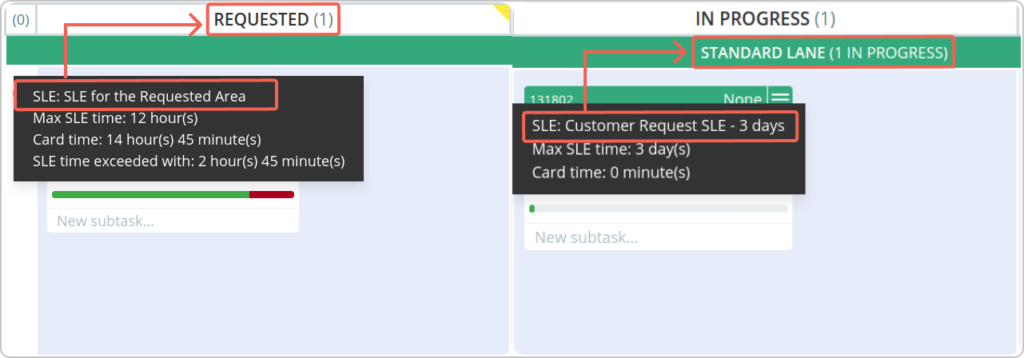
So, imagine that you set a delivery expectation of 3 days for the whole lead time of the support process. To track whether you meet it, you can set up one SLE on the "Requested"/ "Ready to Start"/ "Committed" area of your Kanban board and another one on a swimlane, representing the whole process from start to finish (as we did in the previous example).
In this case, however, the system will visualize one progress bar for the "Requested" area, which will disappear once the Kanban card is moved to "In Progress". From that moment on, you will only see the SLE for the swimlane.
Of course, the way you decide to distribute the max card time threshold between the two will depend on how fast you are able to start working on a new customer request. This trick ensures that instead of only measuring whether your team meets their SLE for active work, you can also set a time target of how long it takes a customer request to go from a "committed" to an "in progress" state.
Using SLEs for Different Types of Work
It's not uncommon to have two or more different SLEs for separate types of work items. For example, imagine that you set an SLE of 4 days for the standard items in your process but you want to make sure that any tasks with high priority are delivered within 2 days.
In this case, the software platform allows you to add card filters when creating a new SLE from the workflow editor. There, you can refine your search criteria and configure service-level expectations for work that comes with a certain priority on top of the standard one.
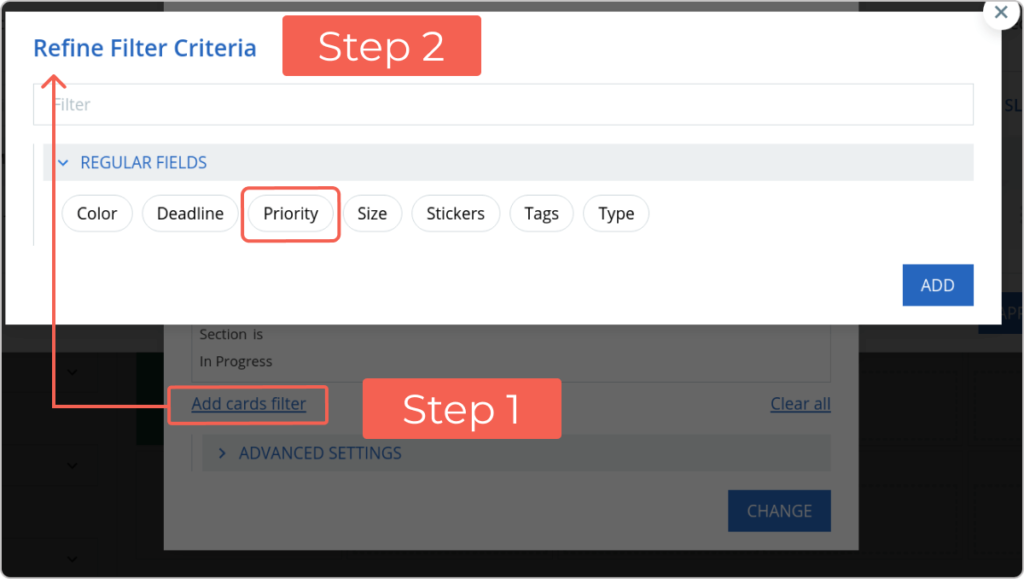
Apart from priority, you can also use the functionality to apply SLEs to cards with specific deadlines, sizes, stickers, and more.
How Service Level Expectations Benefit Your Workflow?
Let's briefly point out some benefits from introducing SLEs to your workflow:
- SLEs represent forecasts based on historical data rather than commitments based on estimations. As a result, you can factor in uncertainty within your service level expectations and derive possible outcomes in order to create a more realistic delivery process in a knowledge work environment.
- Visualizing service level expectations on your Kanban boards allows you to track in real-time whether you are meeting your delivery forecasts and quickly spot risks of work items taking too long to be completed.
- Applying SLEs to your work process and having the ability to monitor them drives continuous improvement too. You can engage in discussions during meetings with your colleagues or other teams in the organization in order to analyze actual workflow data and set the right expectations to deliver on time.
Final Words
Describing all the possible scenarios for setting service-level expectations for your workflow is way beyond this article.
So, if you take away one thing from today, it should be to use historical cycle time data of your process to derive possible expectations for the delivery of a service. This allows you to use probabilistic forecasting and agree on a level of certainty rather than set commitments based on estimations. Everything else is all about experimentation with the SLE configuration and tracking possibilities in Businessmap.
Enjoy the experience!
Try Businessmap Free for 14 days
Iva Krasteva
Content Creator Expert | Agile Practitioner | Kanban Certified
With a background in Intellectual Property, SEO, content writing, and training in Lean, Agile, and Kanban, Iva is an enthusiastic Agile practitioner who embraces collaboration and flexibility every step of the way. Driven by constant learning and knowledge and fascinated by people's creativity.