Decision-Making through Explicit Mental Models
In today’s information-overloaded world, we all need to make numerous decisions in the course of our day. Speed of decision-making is often a critical element. One shortcut we take, whether it happens deliberately or not, is the usage of Mental Models. (See P. Senge’s “The Fifth Discipline”).
Often, when facing a decision, we just make it without any deeper thinking. We just know what is the right thing to do, supported by our beliefs and experience. We are making such decisions on the basis of some mental model, on some well-held belief in how the world works.
Mental models are very useful. They may be imperfect, but they are practical. They give us a lens through which we can interpret reality. They are like a shortcut to avoid overburdening our minds with needless thinking and quickly jump to a decision or action. Mental models help us filter through amounts of data and information without becoming overwhelmed.
Typically, mental models are tacit and assumed to be understood the same way or shared by others. Miscommunication is often the result of people not sharing the same mental models.
Most mental models are also flawed because they offer an imperfect interpretation of reality. Hence, one strategy to improve the quality of our decision-making, is to explicitly focus on better mental models and on making sure that they are explicitly articulated and shared by all people in our organization.
Mental models are often flawed because they are often based on wrong assumptions. Once such assumptions are exposed and reconsidered, then new, more powerful mental models can be derived. They are often bewilderingly simple, to the point that they will seem obvious.
Oftentimes, the new mental models are indeed obvious in hindsight; but that does not imply that they are self-evident to begin with. Generally, we need to do some deep thinking and question our own assumptions before the obviousness is uncovered and becomes self-evident.
Mental models have a profound impact on how we make decisions, and hence on the overall performance of our businesses.
A Mental Model to Explain the Business Value of Flow
To illustrate the power of mental models, let’s try to understand why it makes business sense to focus on flow by highlighting the underlying mental model. In particular, in this post, we are concerned with operational flow and financial flow.
Any business is concerned about how much work, value or financial results they are able to produce as time goes by. Typically, the situation is represented by a simple graph that shows how “well” the company is doing over time. It might look like this:
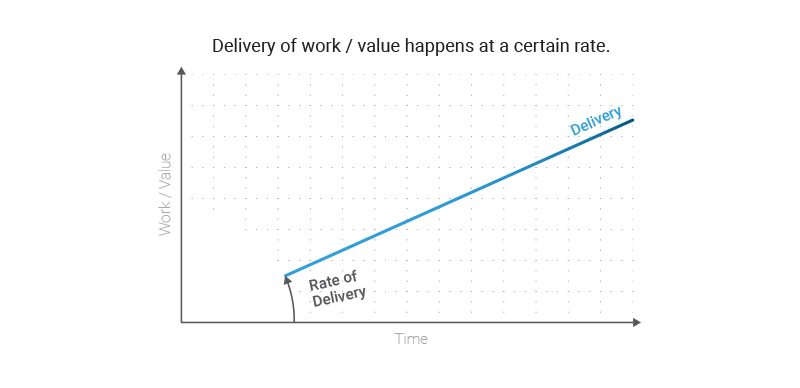
Of course, this is a simplification - it is a model, after all. One such simplifying assumption here is that the rate of delivery is linear; but let’s work with that assumption. The purpose is not to have a perfect model of reality, but to reason about it and see if we can gain some deeper insight.
The Desire to Increase Performance
Most organizations are under pressure to always deliver more. Typically this happens because of the competitive market landscape they operate in. They need to deliver more work which, hopefully, results in better financial results.
It is very common for the business owners to push the organization to deliver more. Improvement initiatives might be undertaken, with the desire and intent to increase the rate of delivery. Such desire can be visualized like this:
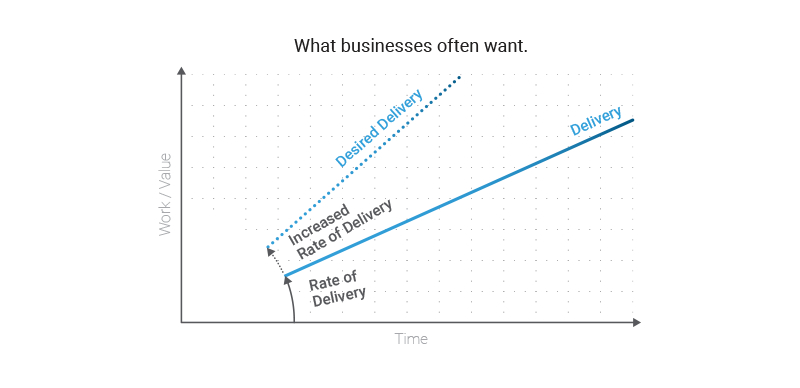
One common assumption is that the organization’s performance is directly proportional to the organizational effort. Hence, the belief that if only the organization would put in “more effort,” it would be able to produce more work per unit of time, and the rate of delivery would increase as desired.
Increasing Performance through Effort Bears Many Downsides
However, increasing the organization’s effort, typically bears costs, like:
- Investments (like purchasing new equipment)
- Staffing (hiring new people)
- Assets (like buying new offices)
- Restructuring (like putting new management structures in place)
- Reorganization (like moving to new premises)
- Retraining (like getting new people up to speed)
- … and so on!
Most improvement operations focus only on trying to increase the slope of that line of delivery. Another, often unstated, assumption is that the desired increase in the rate of delivery can cope with and match the rate of demand; but that rate of demand is often not taken into consideration at all.
The Rate of Demand Is Important Too
If the rate of demand were taken in consideration, we would have to realize that demand arrives at a higher rate than the rate of delivery; and that it happens earlier in time (because work needs to be done between receiving the demand and delivering it).
It might be represented like this:
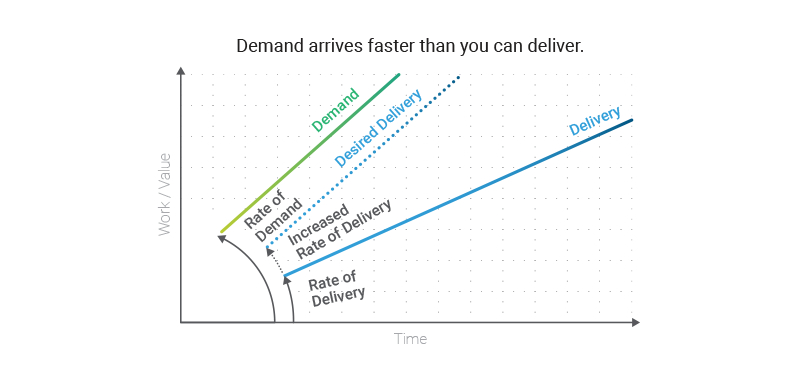
Now that we have plotted these two fundamental lines, the demand line and the delivery line, we can start reasoning about them.
(Besides: these two lines are the fundamental base lines in the so called cumulative flow diagrams, which are well known tools for managing flow. Though here we are not concerned with the finer details of such diagrams, but only with the conceptual model.)
The Difference Between Demand and Delivery Is Even More Important
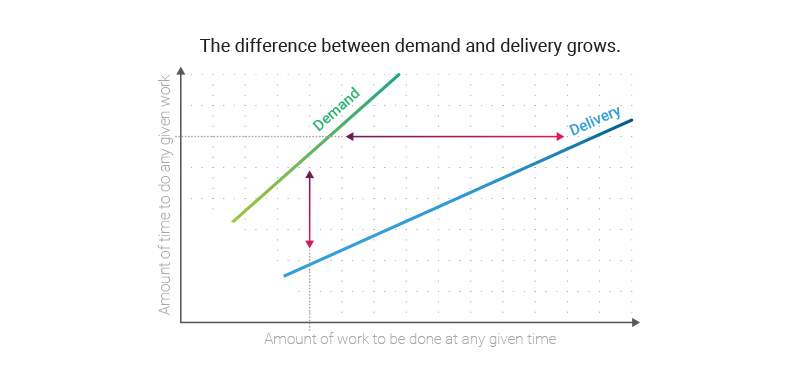
If we consider the difference between the demand line and the delivery line, then the vertical difference between the two lines represents how much work needs to be done, at any given moment in time. The horizontal difference represents how long any given piece of work will take from the moment the demand is created, to the moment the work is delivered.
(Note: this is really a huge oversimplification of what happens in reality; but again, this is an imperfect model which we use to reason about what happens in real life; not to describe things in minute detail.)
We can illustrate the notion like this:
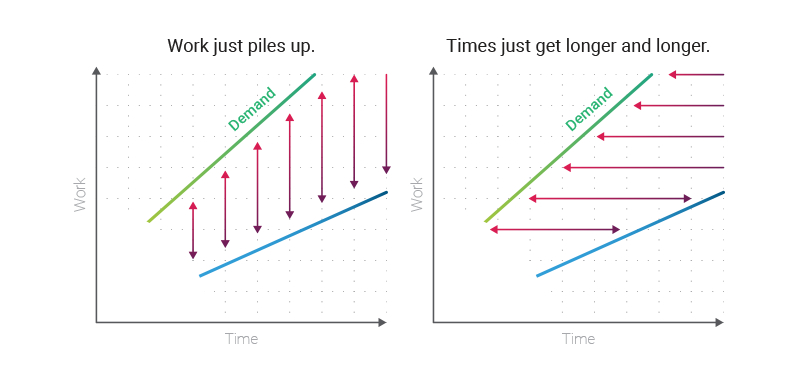
Why Companies Are Always Overburdened
It is very common that most organizations feel stretched, as if they were constantly overwhelmed.
When the rate of demand is greater than the rate of delivery, it is not surprising. Have you ever had the feeling that work just piles up, and gets more and more; while time to finish things just gets longer and longer?
If so, then this diagram can explain why:
The Value of Matching Delivery to Demand
The reason why work actually piles up is not only due to the continuous arrival of new demand. It is also consequence of the fact that (in most cases) the decision to start the work happens almost as soon as the demand is received.
If we combine the learnings from the earlier diagram where we illustrated the desire to increase the delivery rate to such extent that it could match the demand, with the last diagram above (where work just accumulates and times get longer and longer), we can reason as follows.
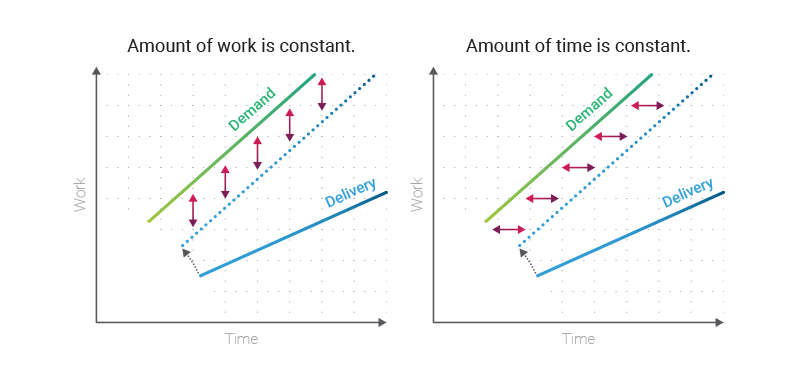
If the delivery rate matches the demand rate (i.e. the two lines are parallel), then the amount of work to be done at any given time remains constant (rather than continually increasing). Likewise, the amount of time to finish any given work would also become constant (rather than being ever increasing).
In other words, the system would become stable (constant amount of work) and predictable (constant amount of time).
On our diagrams, it would look like this:
Yet, no matter how much companies invest in increasing their performance, this ideal balanced and stable state seems never to be attained.
Could there be another way to make those two lines parallel and thereby both avoiding to overburden the system, while making it both stable and predictable?
Thinking about the Demand Line instead of the Delivery Line
It is just so natural to think about acting on the delivery line, and “increase its slope,” because that is what we have direct control over. It is just so natural to want to make the delivery line parallel to the demand line, as that would resolve many issues.
There are other possibilities, however, where focus is not on trying to affect the delivery line.
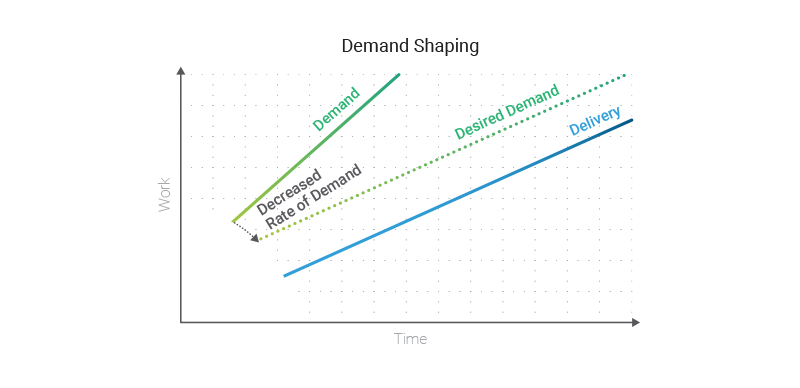
One such possibility is to exercise “demand shaping” and deliberately decrease the slope of the demand line. For instance, one could decide to stop serving the less profitable customers or market segments, and focus only on those of high value.
On the diagram, it would look like this:
Of course, in most places, the idea of serving less customers or a smaller market place is not very popular.
Moreover, in knowledge work, the demand line is often (artificially) steeper than what it really needs to be. (See “feature creep.”) It becomes extremely hard to make the case of reducing the demand, when there are many stakeholders who all claim some critically vital reason for their demand to be immediately served.
The Quest for Stability and Predictability
Whether we try to increase the rate of delivery or decrease the rate of demand, both approaches strive to achieve a condition where the two lines are parallel. When the lines are parallel, the system is not overburdened and, above all, it becomes stable and predictable.
Being stable has huge business value. A stable and reliable system has greater odds of being around next year.
Likewise, being predictable is at the core of being able to “keep our promises” whenever we make any to clients or other stakeholders.
But it seems that achieving this is next to impossible.
On the one side, increasing the rate of delivery is hard, it almost certainly incurs costs, takes time and is (mostly) prone to failure. (Note: the reason why it incurs costs and has high odds of failure will be further explored with the mental models of constraints management.)
On the other side, decreasing the rate of demand is mostly out of our control, and is rarely accepted as a wise and viable business decision.
Yet, there is value in having those two parallel lines.
Could we achieve it in some other way?
Unintended Consequences of Good Intentions
To find that other way, we need to question some of the assumptions, and consequential beliefs, decisions and actions, that typically happen.
Given that the rate of demand is greater than the rate of delivery, the organization is pressured. Decreasing demand is out of the question; and demand pressure invariably results in more and more work in the system.
One recurring refrain is: “We have customers waiting to be served, we cannot let them wait! We must start working on their requests ASAP, so we can tell them they are being served!” The idea is that in order to be responsive and to serve customer needs best, we must immediately jump to action and start working as soon as there is an incoming request.
At the same time, there is this idea that since most work is already late, the sooner you start serving a customer’s demand, the sooner the work will be delivered.
These are the two assumptions that we need to reconsider:
- To best serve the customer, we must be able to tell them we are serving them immediately.
- The sooner you start work, the sooner it will be finished.
Let's explore the ways we can approach rethinking these assumptions.
Stop Starting
As more and more work is pushed into the system, the amount of multitasking increases exponentially. Any work that is started is put aside in order to serve some other urgent request; then that work is resumed; then it is put aside again; then resumed; and so on, and so forth. The pattern repeats over and over again and for all and any kind of work.
It is a vicious circle that effectively makes any work spend most of its time waiting to be worked on rather than actually being worked on.
One way to address this is to focus on any work item and make sure it is worked on until it is done before any other work item is started. The focusing mechanism can be realized by deliberately limiting the work in process.
How can we deliberately do so?
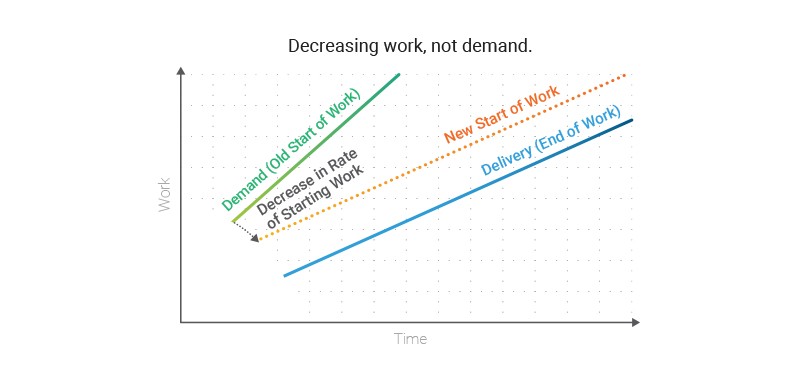
Very simply by not starting any work until there is sufficient available capacity to take care of it. In other words, it is just a matter of deciding when to start work. Rather than starting work as soon as it arrives into the system, the starting is postponed.
Why would this make sense? First, it is another way to try to change the rate of delivery (which we know is costly and prone to failure). Second, by deliberately deciding when to start working, we can determine how much work is loaded into the system; in particular, we can decide to start work at the same rate that we are able to deliver it.
In our simplified diagram, it would look like this:
Limiting Work in Process
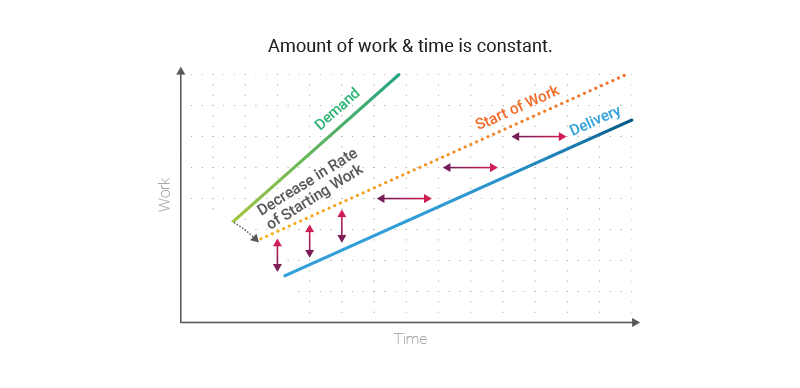
The effect of not starting work is (obviously) that the amount of work effectively being worked on is limited, and because we now strive to start work at the same rate at which it can be delivered, we have the sought-after effect: the two lines are parallel.
The amount of work in the system remains constant, as well as the time from start to finish. The system is not overburdened, but it has become stable and predictable.
By highlighting the difference between the rate of starting work and the rate of delivery, this constantness is clear precisely because the two lines are parallel:
But We Cannot Wait!
The idea of deferring the start of work is hard to digest if we are used to always starting work for the sake of “serving the customer” and being responsive.
Even worse, if we believe that starting working sooner will deliver the work sooner, we might conclude that this postponement will result in an even later delivery and hence discard the idea before thinking any further.
Yet the diagrams show it differently.
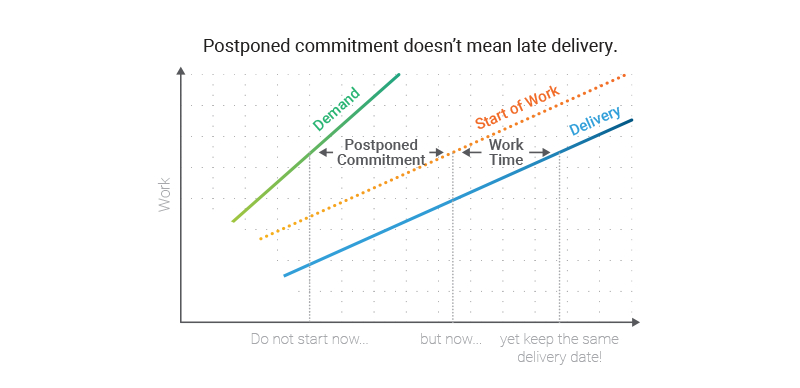
Postponed commitment does not mean late delivery. Since we have not changed anything with respect to the slopes of the demand line and of the delivery line, the overall performance will – at least – not be worse than before. (Actually, it will be better as a consequence of the reduced multitasking.)
The effect of the postponement can be thought of as a rearrangement of the time the work item is actually worked on, and the time the work item is sitting still waiting to be worked on. It is as if (most of) the waiting time is moved in front of the work.
In other words, work is queued in a waiting line until it can be worked on and serviced with no interruptions. The situation is not much dissimilar to what happens when we stand in line for a burger at McDonald’s or for having a ride at Disneyland.
It is a common experience that we wait in line until our turn comes.
Since, from the delivery perspective, there is no apparent delay, there is no reason why a client would perceive this as any worse.
Notably, we can even tell clients how long they will have to wait for their service and predict when they will receive the delivery. Much like McDonald’s and Disneyland.
While nothing changes from the client’s perspective, the positive effect is that we have gained those parallel lines that give us stability and predictability. We will not be overburdened, and we can keep our promises.
At this point, when the system is stable and predictable, we can start to address the real issue of increasing performance.
Touch Time and Wait Time
Even after extracting the “Disneyland attraction wait time” from the overall service time, there is still lots of time that goes wasted. We have weeded out all wait time that is external to our process, but there typically is substantial wait time inside.
We can reflect about this. Let’s start by distinguishing between these two states:
- When work is being worked on, which we qualify asTouch Time
- When work is waiting to be worked on, which we qualify as Wait Time
If in our simplified model, a horizontal line in our diagram represents the time it takes for a piece of work to go from start to finish, we can represent its Touch Time and Wait Timeas follows:
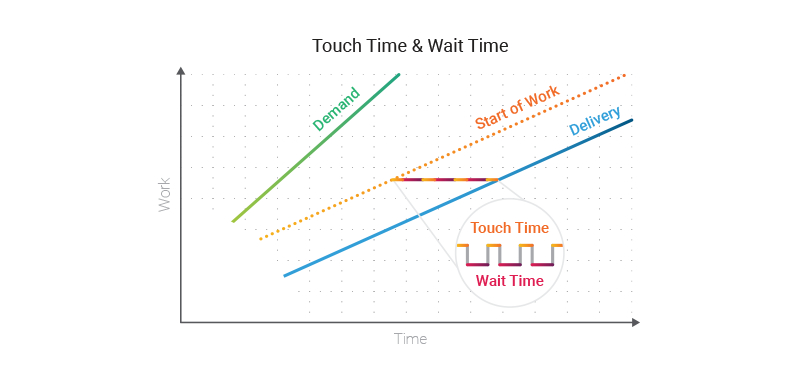
The work timeline is split into two parts; the four segments at the top represent the Touch Time, while the three segments at the bottom represent the Wait Time.
If Touch Time and Wait Time are measured, it is not uncommon to find a disproportionate unbalance between the two, where the total amount of Wait Time is far greater than the total amount of Touch Time. (It is not coincidental that, in the illustration, the bottom segments are longer than the top segments; even though in real settings the disproportion would be even greater than what illustrated, so much that the drawing would have to extend for several pages in width!)
Work Faster or Deliver Earlier?
Conventional improvement initiatives focus on “working faster,” because they aim at increasing the rate of delivery. We know that in order to deliver faster, investments have to be sustained, changes have to be undertaken, and the risk of failure is large.
With the observation that any complex work process is a sequence of interdependent steps, and that the execution time is necessarily divided into Touch Time and Wait Time. Working “faster” obviously means “touching” the work less; focus is decidedly on reducing theTouch Time.
But we do have another option. We can consider the alternative and not try to work faster at all, but to strive to reduce theWait Time(s)!
If we are able to reduce the Wait Times without changing the existing work processes, it means that we do not have to sustain investments, undertake changes or incur risks.
The operation will be much cheaper – it will cost nothing! – and there will be no pain in adopting different working procedures.
The two alternatives can be visualized like this:
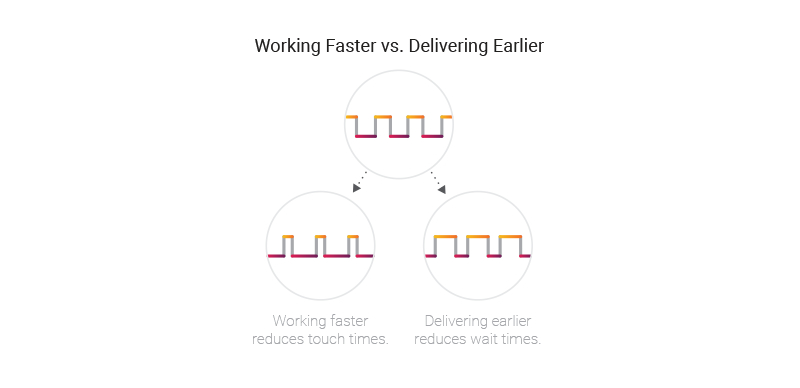
Everything remains as it was: same work processes, same tools, same people, same infrastructure. (Hence no extra cost and a very low risk of failure.) The only thing that changes is in the decision-making about when to start and stop working – in other words, how to coordinate and synchronize work – so that the wait times are reduced.
But the actual working procedure is not changed at all. How brilliant isn’t that?
Delivering Earlier Will Increase Throughput
Now there is an apparent paradox to come to grips with.
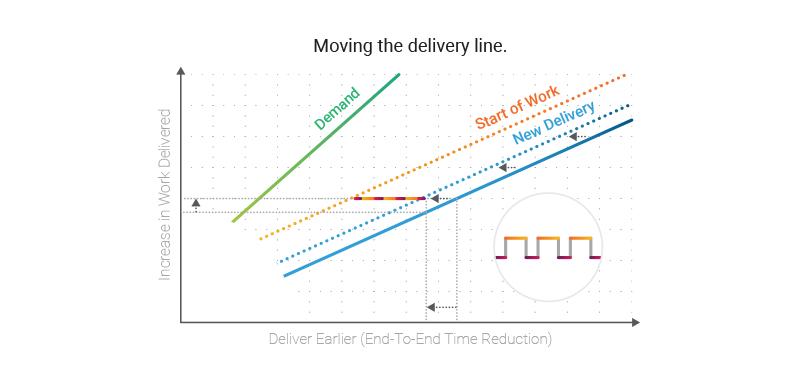
While work is not performed any faster than before – and hence there is no additional stress or burden put on the system or on the people – the time from start to finish is reduced.
In the diagram, this reduction results in the delivery line left-shifting with respect to the demand line. So at any given point in time, the new delivery line will be higher than the old one.
The slope of the delivery line remains the same (because work is not performed any faster than before), but since it is left shifted, the amount of work delivered at any point in time will be greater than before the improvement effort.
It is worth repeating: no effort is expended to try to work faster, and work is still performed at the same speed as before. Instead, the total service time is reduced by reducing the Wait Time inside the process.
On the diagram, it would look like this:
Is It Worth it? The Impact of Flow Efficiency and Little’s Law
The initial model has undergone a lot of elaboration. We have examined a non-conventional way to produce a performance improvement, and the last diagram shows that it is possible to achieve it by postponing commitment and striving to reduce wait times rather than just “work harder” to increase the rate of delivery.
The question that arises: is it worth it?
To reply factually, we would need to run some experiments collect real data, and make the decision accordingly. That’s what we typically do in TameFlow: We make a hypothesis, run experiments, collect data, and decide accordingly.
When we start measuring Touch and Wait times, we will typically find surprises. The amount of Touch Time is always a small fraction of what we might initially expect.
To contemplate how much or little Touch time there is with respect to the end-to-end time (service time), we consider the metric of Flow Efficiency.
Flow Efficiency is the ratio between the Touch Time and the end-to-end service time (i.e. the sum of the Touch and Wait Times), expressed as a percentage. If no attention has been given to these ideas, flow efficiency is very low. Typically it is in the order of 3-7%.
To answer the question if it is worth it, let’s run a thought experiment and reason about a hypothetical improvement.
Suppose that we are given the power to effectively produce a time reduction in the order of 20%. But we have to choose where to apply this. We can choose to decrease the Touch Time (i.e. we increase the delivery rate, this is the conventional improvement thinking of “work faster”); or to decrease the Wait time (i.e. postpone commitment and “deliver earlier”).
Suppose further, for the sake of argument, that the current flow efficiency is 5%. That means that 5% of the whole service time is Touch Time; while 95% is Wait Time.
From the structure of our diagram, which plots Work against Time, we also can quantify the throughput of our efforts in terms of the amount of work produced per unit of time. This is an (extremely simplified) version of the so-called Little’s Law, which is expressed by the equation:
TP = WIP / FT
where TP is throughput, WIP is work in process, and FT is (flow) time.
Our time reduction will be applied to the denominator but with the distinction of the two cases. Here is a breakdown of the reasoning:
| Increase Delivery Rate (“Work Harder”) |
Postpone Commitment & Reduce Wait Times (“Deliver Earlier”) |
| Reduce touch time by 20% | Reduce wait time by 20% |
| Touch time is 5% of total time | Wait time is 95% of total time |
| Total time is reduced by 1% (i.e. 20% of 5%) | Total time is reduced by 19% (i.e 20% of 95%) |
| Total time becomes 99% of the original (100%-1%) | Total time becomes 81% of the original (100%-19%) |
| New throughput increases by a factor of (100/99)=1.01 | New throughput increases by a factor of (100/81)=1.23 |
| The impact on throughput is +1% | The impact on throughput is +23% |
Economic Impact
It is clear that a 20% reduction applied on Touch Time is a much worse choice than an equivalent 20% reduction applied on Wait Time, due to the (generally) bad flow efficiency.
The conclusion is clear: when reducing Touch Time by 20%, throughput will increase by a mere 1%; but when reducing Wait Time by the same amount, throughput will increase by 23%!
The difference is astonishing. But the situation is even worse because in the former case, we have to sustain expenses, reorganizations, restructuring, retraining, and accept all related risks of failure, while in the latter, we incur none of that.
If we examine the changes from a financial perspective by referring to the fundamental equation of throughput accounting (for an introduction to throughput accounting, see the blog post: Theory of Constraints and Software Engineering), the differences in favor of the second choice become even more compelling.
That deciding equation is:
ROI = (T – OE) / I
The return on investment is the difference between the (financial) throughput (i.e. sales minus totally variable expenses) and operating expenses, divided by any investment.
We can reasonably expect the financial throughput to increase in proportion to the increase in operational throughput, so it will be in the order (or proportion) of +1% and +23%, respectively, for the two cases.
Regarding operating expenses, they would increase substantially when trying to “work faster,” for instance, if we have to hire new people; but there would be zero difference in operating expenses when trying to “deliver sooner” because hiring or similar contingencies would never be required (remember that in the second case nothing changes except decision making).
Regarding investments, they would increase substantially when trying to “work faster,” for instance, if we have to buy new equipment (computers, offices, etc.); but there would be zero difference in investments when trying to “deliver earlier” because acquiring new assets or equipment would not be necessary.
Considering that the “working harder” option will need to be sustained by an increase in operating expenses or by additional investments (or, more likely, both), despite the nominal improvement of 20% in Touch Time, the overall improvement becomes a mere 1% reduction in the time to market, the bottom line impact will be almost negligible, if not even negative.
There is no doubt that it is much wiser to try the unconventional approach and “deliver earlier.” Time to market will be reduced by 19%, and operational throughput will increase by 23%; there will be no changes in work processes and, consequently, no increase in operating expenses or investment. Zero changes, zero costs, zero investments, zero risks, but 23% more in throughput.
Basically, the improvement comes for “free” – except, of course, that we need to adopt the new mental model and make decisions (about when to start and when to stop work) accordingly.
This example explains why conventional improvement initiatives that focus on “working harder,” provide only marginal bottom-line effects. As this hypothetical example shows, even a massive 20% reduction in touch time translates into just a 1% increase in throughput. No wonder that improvements of 2-3% are considered as successful. In comparison, a 23% increase in throughput must be considered as miraculous.
The Limits of “Deliver Earlier”
The model presented offers many benefits. When making a deliberate effort to eradicate Wait Times and improve Flow Efficiency, there comes a point where there will be diminishing returns.
At some point, there will be no more Wait Time that can be removed effectively. That is when it will be necessary to consider the conventional option of “working harder.”
That is when we need the support of further mental models – those of constraints management– to learn where to focus improvement efforts and where to invest in order to have a real impact on the organization’s performance while minimizing the risk of failure. Without knowing where to focus the effort (on the constraint), any effort will be totally vain and wasted.
Without such additional mental models, any such effort is very likely doomed to fail or, in the most favorable conditions, produce only marginal improvements, similar to the example above of improving the Touch Time by 20% but not resulting in any significant benefits.

Steve Tendon
Guest Author
Steve Tendon is a management consultant, business advisor, and author. He holds an MSc in Software Project Management from the University of Aberdeen and a MIT Fintech Innovation: Future Commerce certificate from MIT. With a background in Software Engineering, he led the development of numerous applications in various fields. He is the creator of the TameFlow management approach.