Did you know that, on average, workers spend only 60% of their time on value-added activities, with the remaining 40% wasted on non-value-added tasks, waiting, or interruptions? A study found that idle time accounts for a significant portion of production inefficiency.
Separating the value-adding time from the non-value-adding time is at the core of generating a critical metric for measuring work processes' efficiency.
The key to understanding the true meaning of efficiency is striving to eliminate all waste of resources in accomplishing desired results. Perhaps the only constant when discussing ways to achieve efficiency is the dynamics of the term. It implies the mindset of continuous monitoring, assessment, and improvement.
The process efficiency in the knowledge work domain refers to achieving an uninterrupted flow of delivery. A steady flow itself requires tracking and measuring mechanisms. To bring more clarity on the matter, we'll look into:
- What is process efficiency through the Lean perspective?
- How to measure process efficiency?
- How to calculate efficiency with Businessmap?
- Process efficiency use cases and benefits.
Process Efficiency in Lean Terms
One of the great aims of the Lean methodology is to optimize processes and eliminate non-value-adding activities. Improving how teams work together to get more things done better and faster with limited efforts and resources is the essence of one of the most crucial Lean metrics – process efficiency.
Process efficiency refers to the extent to which a process can produce outputs with minimal waste, effort, time, and cost while maximizing value for the customer.
To maximize efficiency on individual and company levels, teams that follow a flow-based approach for managing projects and processes rely on workflow analysis based on historical data and the use of customizable metrics to help them gain actionable insights.
To see how this works in practice, keep reading as we examine a few tools for calculating process efficiency with the help of Businessmap.
How to measure process efficiency?
Measuring process efficiency involves evaluating various aspects of the process to determine how effectively it is performing. Reaping the full rewards of tracking efficiency requires a good understanding of your workflow and some essential metrics such as lead time, cycle time, throughput, work in progress (WIP), and your team's productivity - integral parts of your workflow.
A very simple yet powerful metric helps teams to further investigate milestones and weaknesses - flow efficiency metric.
Measuring how efficient your process is done with the help of this easy-to-remember formula:
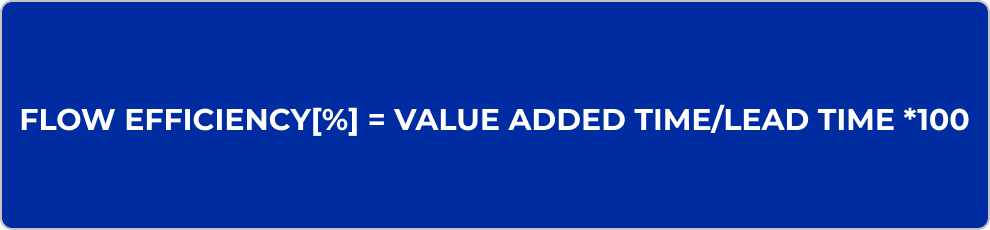
where:
Value added time = Cycle Time - Non-value-added time
Non-value-added time = Wait time + Block Time
This formula tells the ratio between the time an individual or a machine is actively working towards completing a given task (value-added time) and the overall time a task spends in your workflow (lead time) - from order to delivery.
Measure Process Efficiency with Businessmap
With the help of digital platforms, teams can monitor efficiency and gather data about where and what needs to be improved. Integrated with various advanced charts, workflow management solutions provide an in-depth overview of the metrics you wish to track and help achieve Lean efficiency.
To identify process efficiency, Businessmap offers the use of visually appealing, highly intuitive, and customizable metrics.
Initial Board Set-Up
To get an insightful view into the efficiency of your process, take the time to accurately set up the cycle time of each board and think about the activity and waiting stages in your workflow.
- How does cycle time provide key insights into workflow efficiency?
Think of the cycle time metric as the basis for understanding your workflow efficiency. You are in charge of selecting the stages of your process to be calculated in the cycle time. The visualization of your work stages as "activity" or "queue" stages is a great place to start when configuring the cycle time of your work management boards.
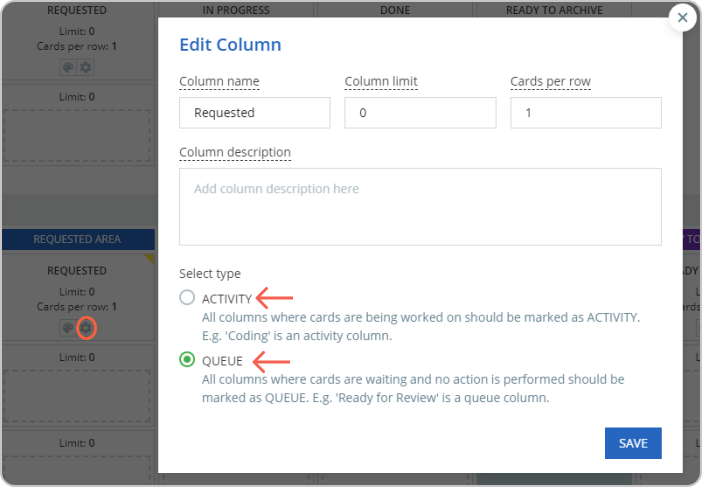
Marking a column as an Active or Queue through the workflow editor in Businessmap
- How do we exclude stages where no active work is done from cycle time configuration?
Since an optimized process corresponds to shorter cycle times, you can exclude the stages where no activity is performed from the cycle time calculation by configuring the cycle time per board.
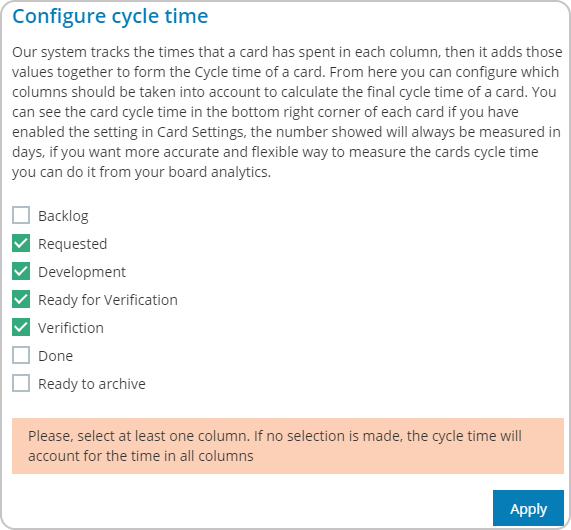
Cycle time configuration panel available per board in Businessmap
Furthermore, the Cycle Time Scatter Plot will help you get a clear view of the individual tasks that took more time to be completed and give you ideas for improvement of the stages they're in or the reason for the delay in their completion.
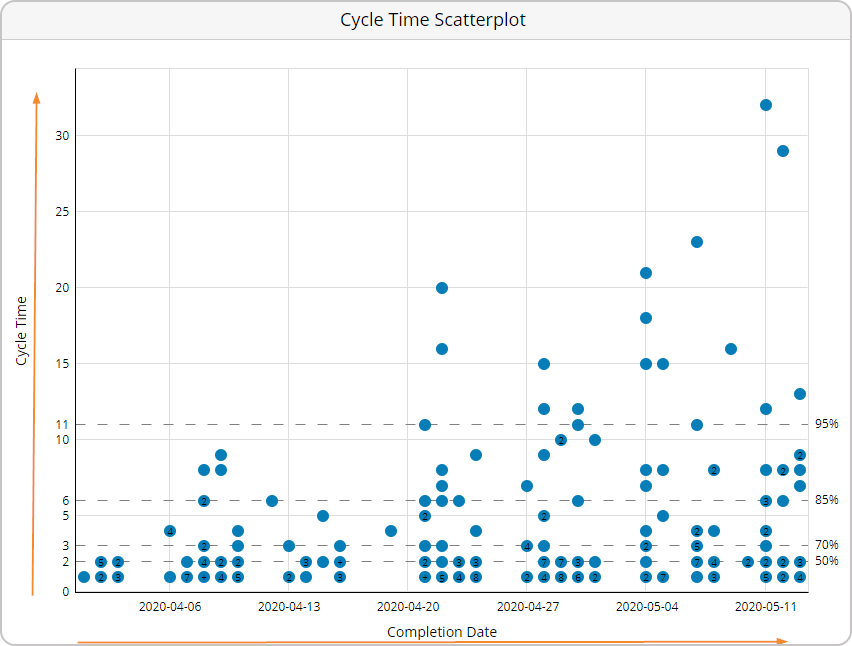
Cycle Time Scatter Plot in Businessmap
Flow Efficiency Chart
The Flow Efficiency chart available within the analytics module of your account allows for a detailed view of the time a task spent in each stage of your work process.
Having a visual representation of both value-adding and waiting times will help you figure out which stages of your workflow need attention and which are going smoothly. You will find out in which stages your team takes less processing time, and you'll be able to analyze the ones where work gets piled up.
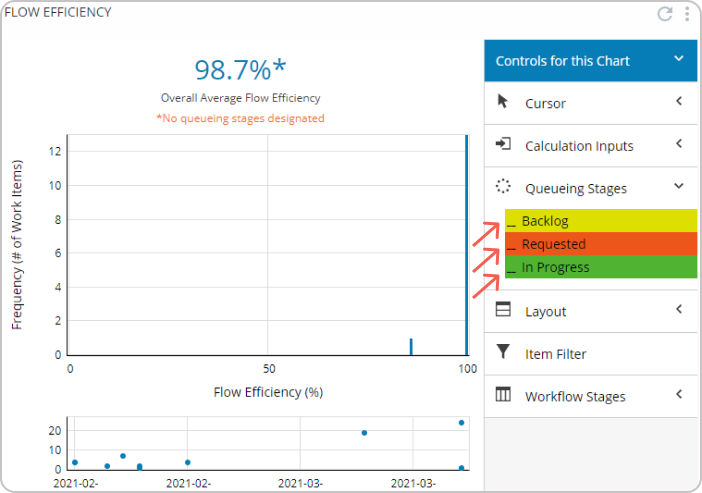
Furthermore, you can configure the Flow Efficiency chart to a great extent. For instance, using the "Add cards filter" functionality, you can visualize only the high-priority tasks processed on a selected workflow for the last month. You can filter the results by assignee, lane, type, or any custom field you created.
To get the most out of the Flow Efficiency chart - understand how fast tasks are flowing through your work stages, and make proper use of the "queueing" columns in the software. These represent the waiting stages in your process. The graph allows you to distinguish these non-value-adding columns from the value-adding steps. This way, you get a clear view of the time spent actively working on given tasks - your workflow efficiency.
Process Efficiency Widget
Being highly dynamic and influenced by internal and external events, you may want to keep an eye on how efficient your process is on a regular basis. At times, you will discover that your team's performance is lower, or you'll find out that there's a stage in your workflow where work gets stuck. To act accordingly, you need solid data to analyze and an alert that something needs attention.
In Businessmap, your alert prompt is called the Process Efficiency widget. With its easy configuration and straightforward visual representation of the results, it is probably one of the most used metrics to monitor how efficient a work process is. The efficiency metric provides an overview of the ratio between value-adding time and non-value-adding time tasks for a given workspace and a period of time.
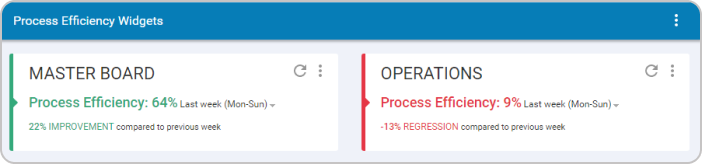
One of the most useful filter options of the widget allows you to exclude weekends from your efficiency calculations or tasks that took an unusually long time to complete.
5 Process Efficiency Improvement Tips to Drive Change
Improving flow efficiency is an ongoing process that requires constant process observation and optimization. Drawing upon our own experience, we share a few useful tips to keep your processes stable and workflows running smoothly.
1. Increase transparency across teams
Using visual management boards is a great way to introduce transparency across teams and locations. Digital platforms allow you to include all team members, set up roles and responsibilities, and use visual marks such as card stickers and blockers to highlight important work items and impediments. Combining these with an automatic notification system where select members are informed about critical events when they occur will make your process more efficient and stable.
2. Start setting up Work in Progress (WIP) limits
Except for being one of the ground Kanban practices to achieve a steady and efficient workflow, the use of WIP limits creates a pool of possibilities for improvement. As such, setting up WIP limits to the waiting (queue) stages of your workflow will help your team be more focused, refrain from context switching, and be quick to deliver. This will inevitably shorten the cycle time and boost the overall workflow efficiency.
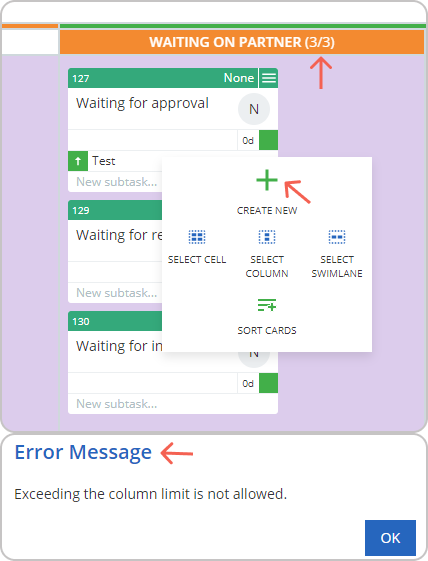
An error message warning that adding a new card is not allowed.
3. Determine columns that generate non-value-adding time
Visualizing the queue stages (columns) of your work process is especially useful when you struggle to keep track of the phases where work is waiting on partners. By creating a column on your Kanban board, such as "Waiting On External Activity" and configuring it as a queue stage, the efficiency of your flow will distinguish between these non-value-adding times and the value-adding tasks. This way, you get an accurate measurement of your process efficiency.
4. Cycle time configuration per board
By properly configuring the cycle time of your work management boards individually, you can exclude the time when your tasks have been waiting on external activity. By ignoring that metric from your cycle time, you get an accurate view of the rhythm of your workflow as well as key observations on team performance and overall process efficiency.
5. Process automation saves time and effort
Automating your processes is a critical factor in improving workflows and an excellent practice to boost the efficiency of your processes. By automating routine and repetitive work, you can reduce manual work entry and errors, speed up delivery time, improving work quality and productivity levels.
Note: Research shows that 78% of business leaders believe that automating tasks at their organization will increase productivity levels for all.
How Process Efficiency Benefits Organizations?
- Tracking efficiency using the Flow Efficiency Chart and the Process Efficiency widget will help you get deeper insights into work performance over time and analyze your improvement efforts.
- Through the use of queueing and active columns, you can easily identify bottlenecks, such as the redundant stages in your workflow.
- Through meaningful configuration of cycle time and eliminating non-value-adding tasks from the workflow, you minimize waste.
Why Measure Process Efficiency?
The ability to identify redundant stages in a workflow, track performance, and gain valuable insights for process improvements are key desired outcomes of a process efficiency analysis. Monitoring these metrics at a glance cultivates a desire for continuous optimization of the work process and makes it all more efficient. Viewing our personal or company efficiency in real-time metrics helps us track our progress and serves as a compass to show us the direction of necessary changes toward efficiency.
Wrap Up
Your workflow will always require your attention. You will have to think and rethink your initial approach, assess your efforts, and draw new conclusions.
By creating a habit of monitoring your process efficiency regularly, you will cultivate a behavior where change is not only an option but a necessity.
Lean principles give you the mindset to embrace improvement and Businessmap - the tools to achieve your goals and excel.
So, how efficient is your workflow?

Iva Krasteva
Content Creator Expert | Agile Practitioner | Kanban Certified
With a background in Intellectual Property, SEO, content writing, and training in Lean, Agile, and Kanban, Iva is an enthusiastic Agile practitioner who embraces collaboration and flexibility every step of the way. Driven by constant learning and knowledge and fascinated by people's creativity.