Managing multiple projects can be a real pain. But should it be? Most managers use endless and complicated excel sheets to collect, track, and process data. It is completely okay, but only if there isn't an easier way.
The problem is that if you do the project reporting manually, it takes too much time. Time that you can invest in creating value for customers.
These days there are so many digital tools that can help you acquire a better project overview at a glance that it is almost a crime not to use one.
Using project progress dashboards is the easiest way to see what is happening with all team projects at a glance.
Why Should You Use Project Dashboards?
Short answer, because it is helpful.
Longer answer - a project management dashboard displays key performance indicators related to specific projects.
It can display metrics for a project's overall performance and progress or highlight particular problems that require further attention. It will allow you to adapt to emerging issues or changes early so that you can decrease the likelihood of project delays due to reworks further down the process.
What to Track?
There are many different metrics that you can track to improve the projects' performance. It depends on what tools your company uses, what methodology your teams use, etc.
There is no one-size-fits-all solution. It always comes to personal preferences and habits.
In classic project management, the required metrics for tracking project progress might be slightly different from Agile project management.
We think it is best to combine the best of the two worlds and make project dashboards that fit your needs.
Here is a shortlist of what you can track and observe to improve your project performance:
- Project Progress reports
- Throughput / Team performance
- Task status
- Critical work items
- Team workload
- Process efficiency
- Proactively manage project risks
- Project Forecasts
- Aging Work
- Activity tracking
Note: One article is not enough to go through all possible scenarios. We will discuss the most significant metrics you can put on your project dashboards in the following paragraphs. We strongly advise you to experiment and find the dashboards that work best in your scenario.
Creating Project Dashboards with Kanbanize by Businessmap
With Kanbanize, it is pretty easy to create valuable and accessible project management boards, share them with all stakeholders, and always stay on the right track.
You can get a quick overview of your teams' performance and have the freedom to include different data depending entirely on your specific KPIs. For example, you can add a few widgets that will help you track:
- Project Progress
- Throughput (the number of tasks completed in a given period)
- Critical Work Items
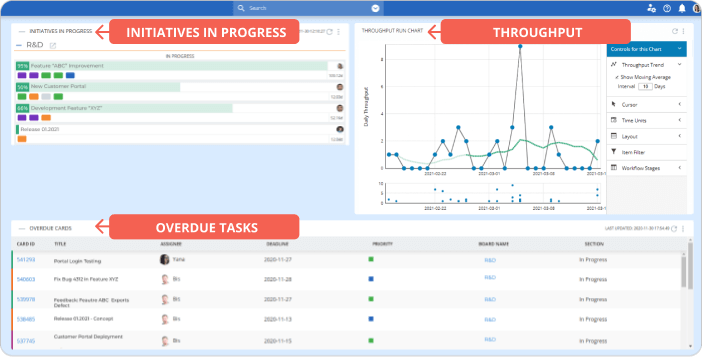
Initiatives in Progress
As you can notice on the image above, you can see the completion rate of any given project that is in progress. The small colored squares that fall under the initiative are all child tasks that form the project.
If you want to know which tasks are completed, which are still in progress, and the ones not started yet, it is easy. You just have to remember the following: green means a task is completed; orange means a task is in progress; blue means a task is requested but not started yet; gray means a task is in the backlog; violet means a task is completed and archived.
Throughput Run Chart
The Throughput Run chart shows how many work items your team completed in a given period. Tracking the throughput will allow you to identify problems and stabilize your process in time. For example, if you see a decreasing line of weekly throughput, probably your team is blocked and needs help to resolve an issue. Remember, this metric is not for surveillance or micromanaging but for problem-solving, process improvement, and achieving a predictable workflow.
Overdue Tasks
As a project manager, you probably prefer to know if there are tasks with overdue deadlines. Luckily the software offers an inbuilt widget that you can put on your project dashboard and observe overdue tasks at a glance. Hopefully, this widget will always say "No results found", but it is advisable to add it to your Project Dashboard to stay on top of delays and ensure project success.
You probably wonder if you can track workload and other helpful metrics. Of course, you do. Unfortunately, we cannot describe everything in a single screenshot, so stick with us.
You can see three more useful widgets that you can add to your project dashboard on the next image.
- Timeline report
- Workload / Capacity
- Project Forecasting
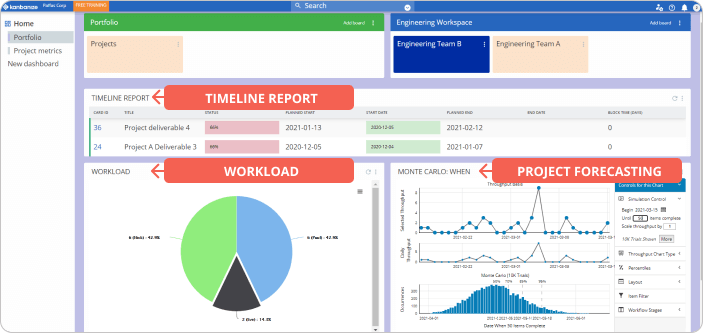
Timeline Report
You can take advantage of The Timeline report. It gives you a quick overview of all projects on your timeline workflow. You don't have to switch between different tools and collect data manually. The only thing you need to do is go to your dashboard and see if the projects are progressing as expected or running behind schedule. You can see the planned start date, the actual start date, and the number of blocked days for your convenience.
Project Forecasting
Wouldn't it be great if you knew when projects will be completed? With Kanbanize, you can actually make data-based predictions about when you expect to deliver projects. It is possible through the Monte Carlo widget. Based on your historical flow data, it gives you more reliable predictions than wishful estimations. For example, you can see on which date five projects in your pipeline will be completed and what the possibility for that to happen is.
Workload / Work Distribution
Finally, most project managers prefer to keep track of teams' workload to allocate capacity if necessary. With Kabanize, you can easily create a custom report that shows you the availability of all team members and the number of tasks they work on. It is an easy and effective way to identify and prevent overburdening or unhide free capacity.
Aging Work in Progress (Bonus)
This is one of the most helpful charts in Kanbanize. It shows the work items currently in progress and tasks whose cycle time is higher than the average for the flow's current work stage. In other words, you can identify tasks that are taking more time than usual and act accordingly.
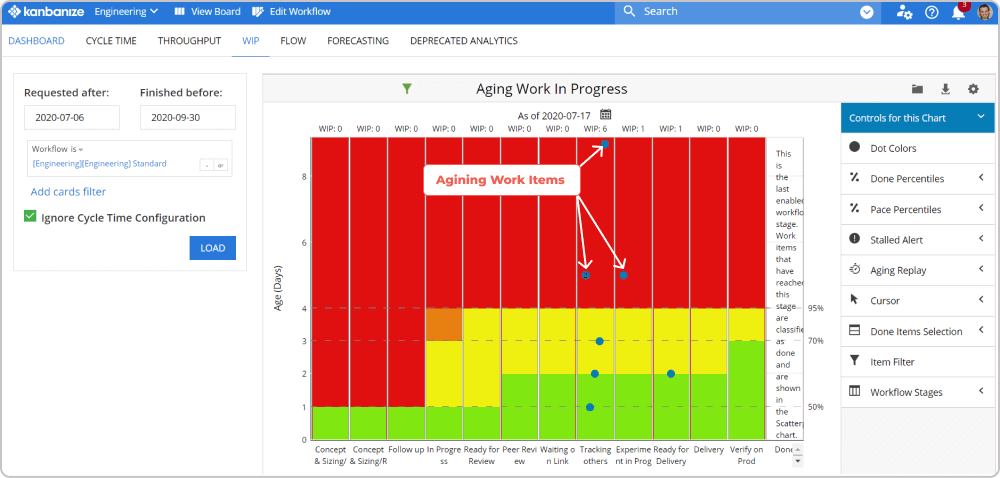
Simply said, every item in the red zone requires special attention. The more tasks in the red area, the higher the chances for slower project completion.
Benefits of Using Project Progress Dashboards
We always try to deliver value to the customers, so they can benefit from using our platform. At the end of the day, it all comes down to how helpful your service or product is. So, let's talk about the benefits.
We can conclude that there are two main benefits of using project dashboards:
- Project dashboards enable you to organize critical project data in one place and make it visible to relevant stakeholders.
- You can quickly spot problems and risks and act accordingly.
If we go into deeper details, we can discover those project dashboards are helpful on many different levels. When team members, project managers, and stakeholders all have access to their project's progress, risk, and projections, they experience significant benefits:
- Better Communication
- Improved Collaboration
- Increased Efficiency
- Ability to quickly adapt to changes
- Set realistic SLAs (Service Level Agreements)
- Align service delivery processes
- Improve project processes
What More Can You Do?
As mentioned in the beginning, there are various metrics and KPIs you can track on your project dashboards. We only scratched the surface with this article. We advise you to dig deeper and create the project dashboard that fits your needs best. If you have any questions, don't hesitate to contact us.

Pavel Naydenov
Head of Marketing | Kanban | PPM Ops Certified
Pavel is a natural-born optimist with 10+ years of experience in the marketing field. By leveraging Kanban, Lean, and Agile practices for years, he drives brand growth and engagement through data-driven marketing strategies. He believes every message should express the fundamental values of a brand, and if delivered positively, it can change the course of its existence.