Did you realize that a technique used by athletes and chess players could also be a game-changer for you? Many top athletes use the method of visualization, mentally picturing their victories before they happen. This approach, often referred to as "imagery," isn't just for sports; it's also used by the military, healthcare professionals, and musicians, thanks to its proven benefits.*
In this blog, we'll explore how the power of visualization is harnessed in the business world. We'll introduce you to the SIPOC diagram, a tool that helps map out business processes, enhance problem-solving, and ensure everyone in an organization is on the same page.
What Is the SIPOC Diagram?
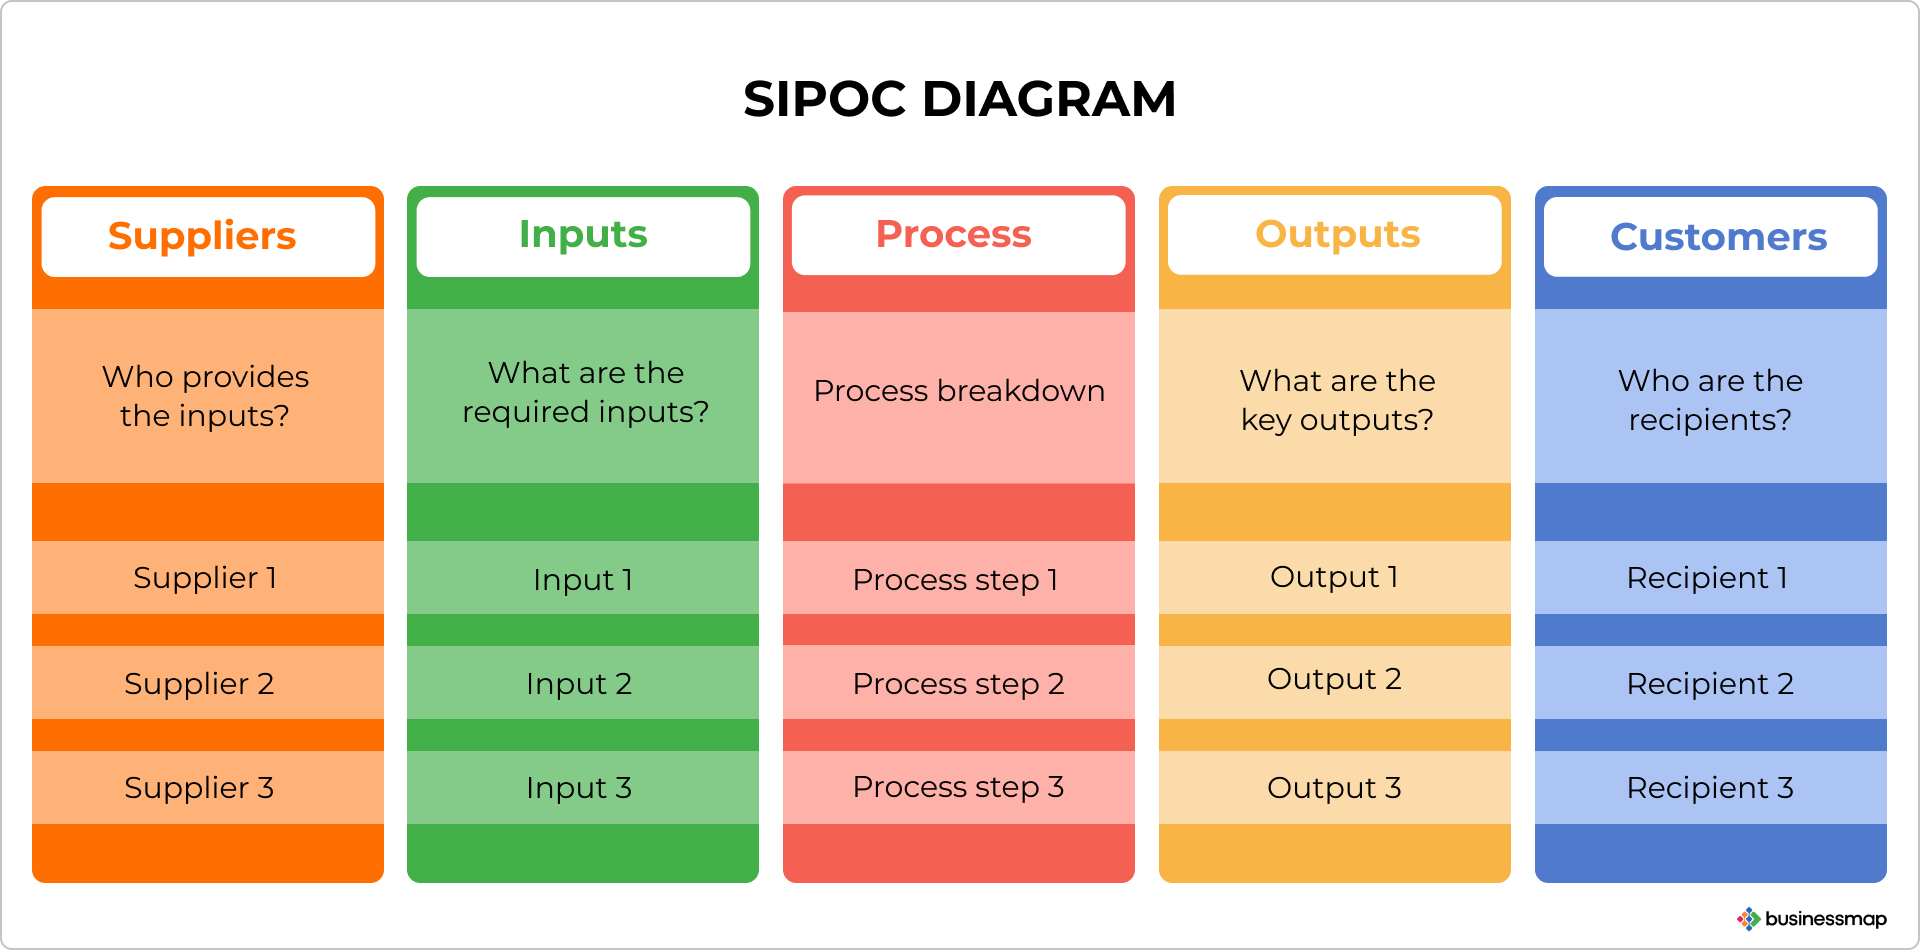
А SIPOC diagram is a visual representation of business processes in table form. The acronym stands for Suppliers, Inputs, Process, Outputs, and Customers and it's perceived as a business process map. It is used to define the inputs and outputs of a process from its initiation to its completion.
The goal of the SIPOC technique is to determine results, identify inefficiencies, and provoke process improvement efforts by providing a high-level overview of the current processes and challenging people to define new and improved ones.
Applying the SIPOC tool brings everyone on the same page about projects and processes, from new employees to stakeholders. It brings a unified understanding of the process or issue at stake. The transparency it creates facilitates the identification of non-value added areas and lays the foundations for problem-solving actions. While helping to bring alignment across the organization, the SIPOC approach is a straightforward but also very simplistic way of mapping a business process. It is best used in addition to other techniques.
Here's how a hiring process operation can be mapped using a SIPOC diagram.
| Suppliers | Inputs | Process | Outputs | Customers |
| Human resources, hiring manager, applicants | Job post, interview questions list, interviews |
Hiring managers identify the need for hiring Human resources post vacancy, performs pre-interview tests, sends a list of approved candidates to hiring manager Interviews Application selection Employee onboarding |
Published job posts, performed screenings, interviews summary | Human resources, hiring manager, applicants |
SIPOC Components
The SIPOC diagram represents all the inputs and outputs of a process in a table format. The components of the acronym are listed and explained below:
1. Suppliers: the providers of inputs to the process that have a direct impact on the outputs. They can be internal to the organization or third parties. In a SIPOC diagram for upgrading a production line, for example, the suppliers can be a maintenance team, line operators, and contractors. They all influence the output of the process - upgrading to the new production line.
2. Inputs: resources, material, equipment, or data required to complete the process and produce the outputs. These entities are provided by the suppliers. It's important to capture the most significant inputs. In an engineering process, these can include creating electrical plans and drawings, preparing electrical installation and cabling, etc.
3. Process: refers to the steps that make up a process. It connects the inputs with the outputs of the process. It represents a process map including 4-5 high-level steps. When upgrading a production line, such steps could be posting upgrading the equipment, establishing benchmark criteria for the new line, testing.
4. Outputs: the key products or services resulting from the process. Both inputs and outputs can be any type of resource or completed actions. The outputs are broad and neutral in nature and reflect the value required by the customer. The outputs in our engineering process would include a variety of reports: safety report, test operation report, energy savings report, etc.
5. Customers: refers to anyone who benefits from the process outputs. Both suppliers and customers can be internal or external to the organization. The recipients of the outputs in an engineering process would be the maintenance team, partners, end clients, as well as line operators themselves.
Why Are SIPOC Diagrams Important?
SIPOC diagrams are an established quality-management technique utilized in Six Sigma project management and other process improvement models. They are ideal for identifying the root causes of process variation and measuring and controlling these variations to arrive at a more stable and predictable process.
SIPOC diagrams are excellent for analyzing and improving business processes. Thanks to their easy-to-use nature and application of less specific language, they are easy to understand and can be applied to any business context. They are equally useful for onboarding new team members, filling in newly added members to a project and stakeholders alike.
SIPOC diagrams allow to define the specifications of the process inputs and determine who is expected to supply the said inputs so there are no misunderstandings. It also helps to identify the customers in the process along with their specific requirements.
What Are the Benefits of SIPOC?
The SIPOC tool can be used to bring on board new people unfamiliar with a process and help align a common understanding of a project's goal. It is equally beneficial to employees and stakeholders alike. Some of the key benefits of SIPOC are listed below.
- Transparency: SIPOC brings transparency and alignment about the process across the organization.
- Overview: Provides a high-level project overview for strategic management.
- Process Documentation: Can be used for process documentation and templates for processes and projects.
- Training: SIPOC can be used as training material for onboarding.
- Stakeholders Identification: Helps to identify properly the suppliers and customers.
- Clarification: Helps to clarify the inputs and outputs requirements.
- Problem-Solving: Supports problem-solving initiatives within the process.
What Are the Disadvantages of SIPOC?
The drawbacks of SIPOC diagrams are related to their simplicity. While they increase transparency across the organization, they are often insufficient to solve process-related issues on their own.
- SIPOC diagrams can be insufficient to resolve process issues.
- SIPOC is a simplistic approach to process mapping.
- It works best complemented by other tools.
What Are the Examples Of SIPOC?
The tables below demonstrate the suppliers, inputs, processes, outputs, and customers, providing examples of the SIPOC.
Production Line Upgrade
| Suppliers | Inputs | Process | Outputs | Customers |
| Maintenance team | Electrical plans and drawings | Establishing and validating production line criteria | Safety compliance report | Maintenance team |
| Electrical contractor | Electrical installation | Upgrading equipment | Energy savings report | Line operators |
| Line operators | Cabling | Testing the line for correct operation | Test operation report | End customers |
Car Purchase
| Suppliers | Inputs | Process | Outputs | Customers |
| Car dealers | Car models | Performing test drives | Car | Car buyers |
| Individuals | Specifications | Shortlisting models that passed pre-tests | Paperwork | Companies |
| Companies | Pricing | Purchase | Service contract | Re-sellers |
Restaurant Food Preparation
| Suppliers | Inputs | Process | Outputs | Customers |
| Owners | Original recipes | Prep cook operations | Cooked meals | Owners |
| Raw food supplier | Fruits, vegetables, dairy products | Adding ingredients | Customers | |
| Electricity and gas provider | Electricity, gas | Cooking specials |
SIPOC Diagram Templates
There are several SIPOC diagram templates available to get you started. Here are some common options:
- Software applications: Tools like Lucidchart, Visual Paradigm, and EdrawMax offer SIPOC diagram templates within their software. These templates are pre-formatted with designated sections for each SIPOC element, making it easy to add your specific details.
SIPOC diagram template representing a business process using a visual board
- Microsoft Office Suite: You can also create SIPOC diagrams using Microsoft Word, Excel, or PowerPoint. These won't have pre-built templates, but you can create a table or flowchart with designated sections for each SIPOC element.
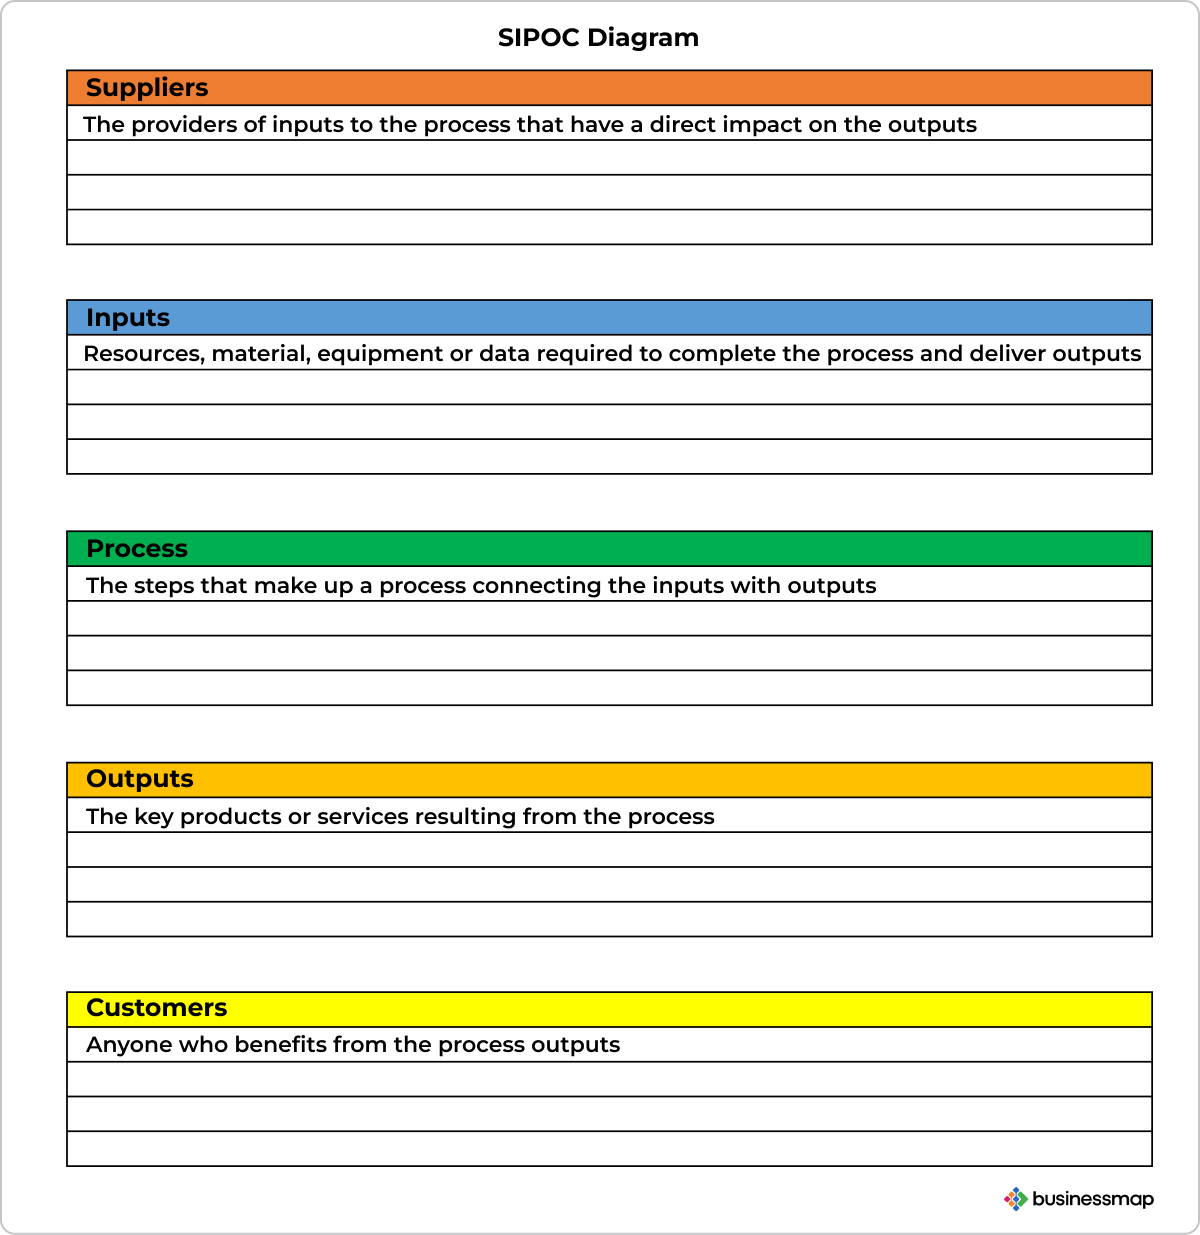
SIPOC diagram template visualizing a business process using a Word document
How to Create a SIPOC Diagram?
SIPOC diagrams can be created following five key steps.
1. Map The Process. Break down the process into up to five high-level activities comprising the business process.
2. Identify The Process Outputs. Include up to five key process benefits.
3. Identify The Customers. Determine the recipients of the process outputs - external or internal.
4. Determine The Process Inputs. Map the key inputs necessary for the process completion.
5. Identify The Suppliers. Determine the suppliers of the inputs required by the process.
Once the diagram is complete, it has to be shared with project leaders and stakeholders for its verification before implementation.
How Does SIPOC Help in a Six Sigma Project?
Being one of the most widely applied sets of tools and techniques for process improvement, Six Sigma utilizes the SIPOC diagram during the definition phase of Six Sigma project management. The Six Sigma approach achieves improvement by identifying and removing the root causes of defects and minimizing variability in the process. This is where the two models intersect and complement one another.
Similar to flowcharts, SIPOC diagrams are visual representations of business process mapping. They provide a clear and concise overview of the inputs and outputs of a process, defining the suppliers and customers. By visualizing on a diagram the root causes of variation in a business process, the SIPOC tool supports the key objective of Six Sigma - identifying and reducing variation. By mapping a process on a SIPOC diagram, you will gain a better understanding of how each item would impact the process benefits (outputs).
By helping to identify the root causes of process variation, SIPOC diagrams can be beneficial to measure and control variations. Breaking down the sources of variation for each SIPOC category unlocks key insights into process impediments and improvement opportunities. As a result, due to reducing process variations, you will ultimately decrease the outputs' variation and make your process more stable and predictable - one of the key Six Sigma assertions.
SIPOC Diagram Frequently Asked Questions (FAQs)
What Is the History of SIPOC Diagrams?
The origins of the SIPOC diagram can be traced back to the late 1980s, when it was used as part of the total quality management (TQM) approach and the Six Sigma model for continuous process improvement. The technique is used during the DMAIC improvement cycle's definition phase, where project goals, challenges, scope, and time frames are clearly defined. SIPOC also plays a complementary role in lean manufacturing and business process improvement programs.
Which Industries Can Use SIPOC?
The SIPOC diagram is a comprehensive process improvement technique that captures a process along with its inputs and outputs in a single map available to everyone. As such, the business mapping model can be successfully used by every industry, organization, department, or individual. Some of the most prominent applications of the SIPOC visualization are listed below.
- Manufacturing
- Construction
- Services
- Banking
- Tech
- HR
What Is the Difference between a Process Map and a Value Stream Map?
Business process mapping is a structured method for documenting what a business process is, who is responsible for its completion, what its inputs and results are, what represents a business's success, etc. On the other hand, value stream mapping is a Lean management approach that displays all the important steps in a delivery process, visualizes work items, and facilitates traditional status reporting. While the ultimate goal of the business process map is to help organizations have more effective processes, value stream mapping highlights the value each process step creates. VSM drives process changes, while business process mapping strives to make existing processes more efficient.
Sources:
Psychological Imagery in Sport and Performance
Seeing Is Believing: The Power of Visualization
Try Businessmap free for 14 days
Iva Krasteva
Content Creator Expert | Agile Practitioner | Kanban Certified
With a background in Intellectual Property, SEO, content writing, and training in Lean, Agile, and Kanban, Iva is an enthusiastic Agile practitioner who embraces collaboration and flexibility every step of the way. Driven by constant learning and knowledge and fascinated by people's creativity.