Table of Contents
Your team's throughput is a key indicator in Kanban, showing whether your process is productive or not. Although the number of analytics tools that measure it increases by the day, there is hardly a more straightforward way to track and visualize throughput than histograms and charts.
Before digging into the specific tools that measure your team’s performance, let’s get the basics and reveal what throughput is, how to calculate it, what benefits measuring throughput brings, and how to make the best of it.
What Is Throughput?
By definition, throughput is the number of work items passing through a system or process over a certain period of time. Throughput is one of the essential Kanban metrics. Therefore, improving it is a major goal for leaders practicing Lean and Agile project management.
Let’s say you want to know how many tasks your team can complete on a weekly basis. To get that data, you need to calculate the delivered work items in your workflow daily. Let's say that your team completes 3 tasks on Monday; 2 - on Tuesday, 3 - on Wednesday, 4 - on Thursday, 5 - on Friday. You can easily calculate the average throughput rate of your team: (3+2+3+4+5)/5 = 3.4 tasks. Now you know that your team can deliver 3 tasks per day, or that’s the average daily throughput rate of your workflow.
If you want more accurate forecasts of your team’s capacity, a good practice is to attach a probability to your results.
How to Measure Throughput?
The throughput metric along with WIP (work in progress) and cycle time, constitute what is known as Little’s Law which describes the predictability of movement inside a queue. The law is usually stated as:
Throughput = WIP / cycle time
This is also a good formula to use when you want to determine your WIP limits.
With state-of-the-art visual representations offered by modern Kanban solutions, throughput data is accessible, comprehensive, and easy to track.
Let’s find out more.
What Is a Throughput Histogram?
Histograms have been the preferred method by project managers for data visualization. Their greatest benefit is the ability to visualize the shape of your data and to prove that it is or is not evenly distributed. With the help of histograms, you can monitor basic information about the dataset, such as the overall distribution of the assignments that are being displayed.
Simply put, the throughput histogram aims to visually represent your team's productivity in the past. It is measured by the number of finished tasks each day and how long it took for this to happen.
The vertical axis shows the number of days that had a certain throughput. The horizontal axis on the projected histogram represents the actual throughput as a number of work items completed. Each column contains the number of days that had the same throughput. The different columns' height depends on the number of days that fall into it as a category.
Furthermore, with the Throughput Histogram, for instance, you can apply filters to visualize data for a specific time period, exclude data based on priority, assignee, the color of the cards, and more.
What Is a Throughput Run Chart?
The Throughput Run Chart allows you to visualize how fast the work items flow into your system. By representing the average throughput trend, you can understand how many tasks your team can deliver over a certain period of time and make better forecasts based on historical data.
The vertical axis on the Throughput Run Chart represents the number of completed work items, while the horizontal - the timeline.
The depicted chart above shows that this team completed around 15 work items on a weekly basis. The sum is derived from the average weekly throughput for an interval of 10 weeks. The data reveals how stable and consistent the delivery is. The green line shows the average throughput trend, which can be used to identify patterns in your workflow.
The customization options within the Throughput Run Chart allow you to visualize only cards from a certain type, exclude specific stages of your workflow, select to view the throughput trends, and more.
Why Use the Throughput Metric?
According to the first State of Kanban report, one of the top reasons for the Kanban adoption is its potential to increase delivery speed, preceded only by the enhanced visibility of the workflow. Why do these two factors stand out?
Image Credit: State of Kanban
The importance of the Kanban throughput metric and its significance to Lean/Agile project managers derives from the following benefits:
- Provides overview into the consistency of a work delivery into a system
- Provides insights over a team’s performance
- The trends allow predicting the future distribution of work with probability
- Allows timely identification of periods where work delivery slows down
Having an overview of the workflow provides control and empowers project managers to focus on improving the work process continuously.
How to Make the Most of Your Throughput Data?
Kanban applies the build-measure-learn cycle, where analysis plays a key role. This is why every manager needs to be aware of the key metrics to track and consistently gather data of the KPIs. Comparing results with previous periods is valuable knowledge and could play a crucial role on a strategic level.
The throughput metric results represent the accumulated data in a visually appealing way and are ideal for presenting to stakeholders.
With the filters' help, you can visualize precisely what you wish to examine and be very specific when monitoring, tracking and sharing it.
To get the full picture of your process, monitor throughput project histograms and throughput run charts, along with cycle time histograms.
We offer the most flexible software platform
for outcome-driven enterprise agility.
In Summary
The Kanban throughput reports provide some of the most useful analytical data you will need to track your Lean metrics.
- It provides visualization of the throughput data distribution.
- Throughput histograms help you identify productivity and efficiency issues.
- Tracking throughput will enable you to act to maintain a stable workflow.


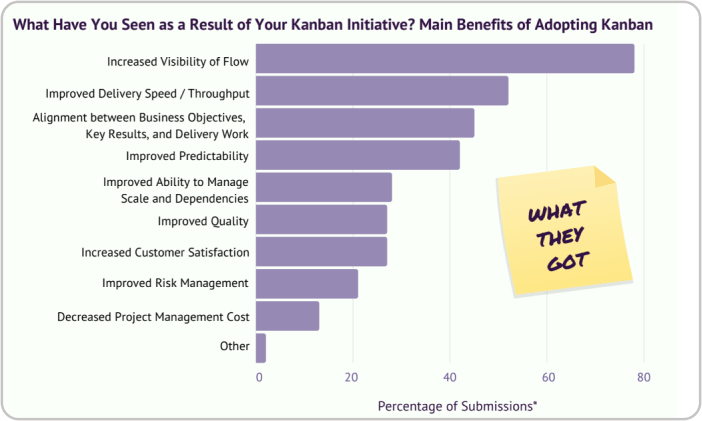 Image Credit: State of Kanban