In our experience working with organizations and teams globally, we’ve often talked to people who struggle to transfer their Scrum process into our platform. The most common objection is that iteration and flow-based processes can hardly co-exist.
And while we’ve debunked this myth before, we wanted to be clearer on how the process works in practice. That’s why we’ve decided to provide you with a comprehensive guide on how you can manage your sprints on Kanban boards.
Before we begin, keep in mind that we will be using Businessmap as a platform, and we will present the content in 3 main categories:
- Structuring a Scrum Process on a Kanban Board
- Using Story Points and Measuring Velocity
- Embracing Flow Metrics for an Iterative Process
Let’s get straight into it.
*Note: The implementation shown below is a possible use case out of many other scenarios! If you’d like to discuss how to apply certain practices to accommodate the platform to your Scrum process, don’t hesitate to contact us.
How To Structure a Scrum Process on Kanban Boards?
If you’re familiar with our product, you will know that there’s a wide variety of customization options you can apply on a Kanban board. Hence, there’s nothing stopping you from replicating a typical Scrum board with a few additions for extra visibility.
Let’s see how.
Designing Your Scrum Workflow
Scrum prescribes an iterative process that begins with a central backlog of unrefined user stories known as the “Product Backlog”.
On a digital Kanban board in our platform, you can simply turn your “Backlog area” into a “Product Backlog” where you can visualize user stories and epics in the form of cards. The idea is to have a central place to store your work and then continuously add more details to those product backlog items (PBIs) as the next sprint approaches.
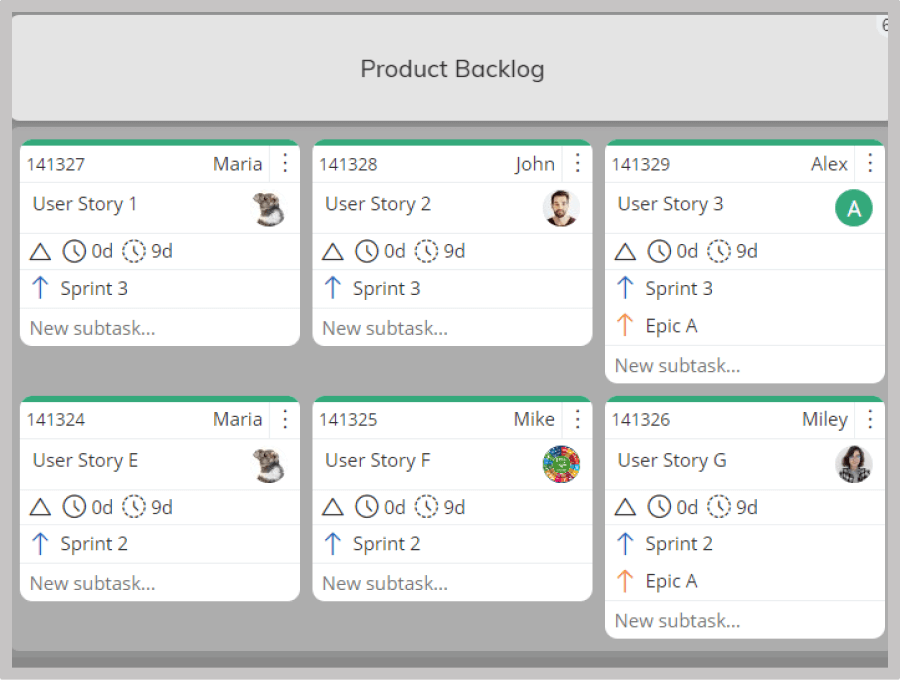
The backlog area is flexible, so you can visualize what you roughly plan to do in future sprints for better clarity of the process. Of course, our recommendation is to continuously check your backlog and discard or move work accordingly as a result of your refinement sessions.
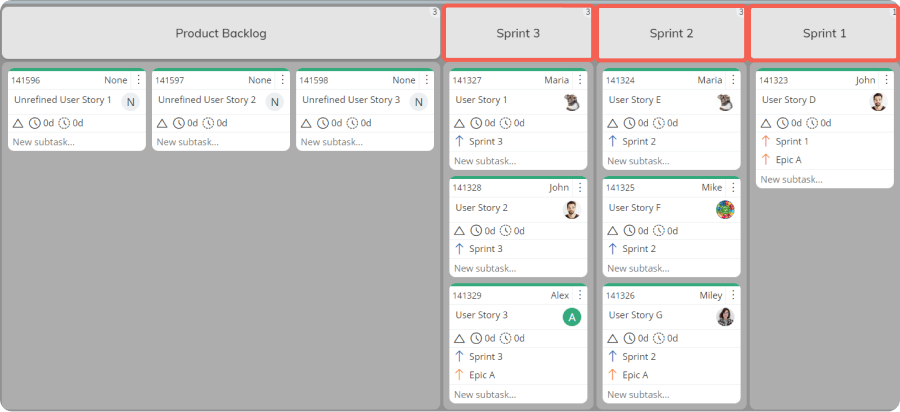
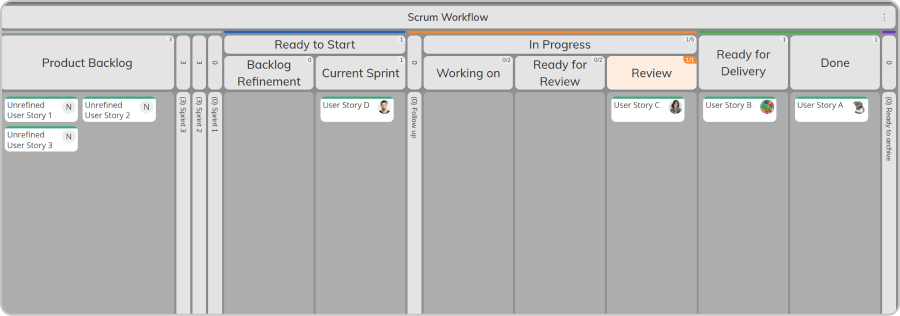
To complete the design of a Scrum workflow on your Kanban board, you might build the following process:
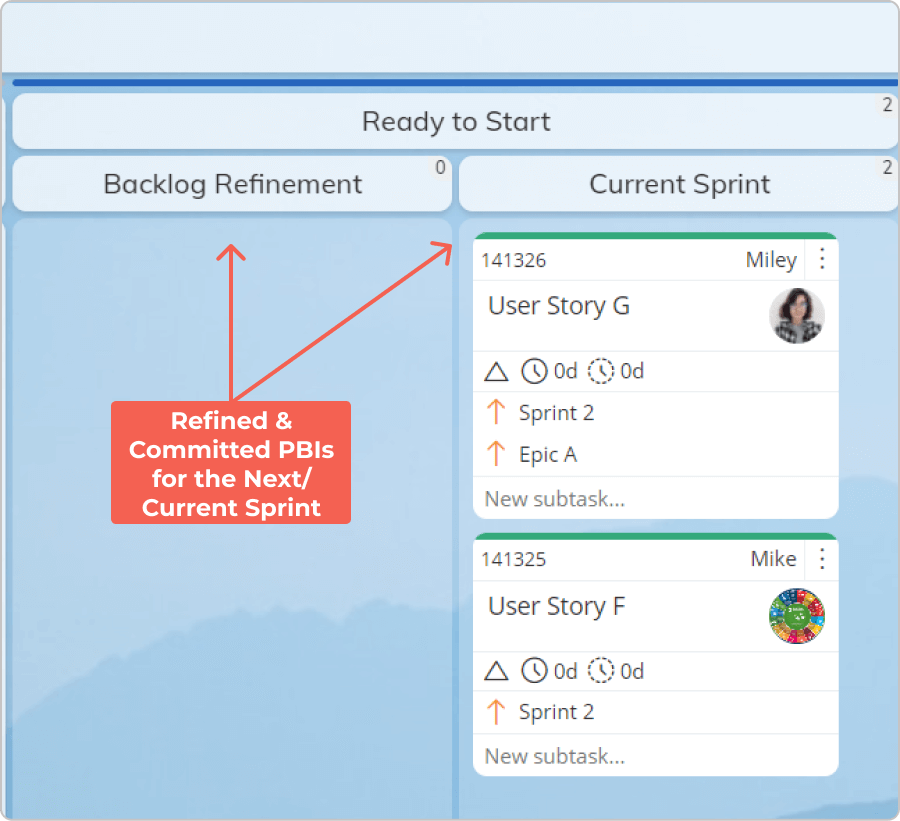
- Requested area – In Kanban, this is what we call a “work commitment” point. In a Scrum process, this could be your “Sprint backlog”, where you commit to user stories for the next sprint. Our recommendation is to divide the Requested area into 2 parts to visualize both the refined PBIs and those you’ve actually committed to deliver in the sprint.
- In Progress area – This is where the actual work happens after you’ve agreed on a “Sprint goal” and have committed to a bunch of user stories to accomplish that goal. A simple process could include “Working on”, “Ready for Review”, “Review”, and “Follow up” columns. A good Lean management practice is to label all columns where work stays idle (waiting) as “queue”, so you can measure your process efficiency later. Also, we recommend applying WIP limits to both your activity and queue columns which will help you alleviate bottlenecks in the course of your iterations.
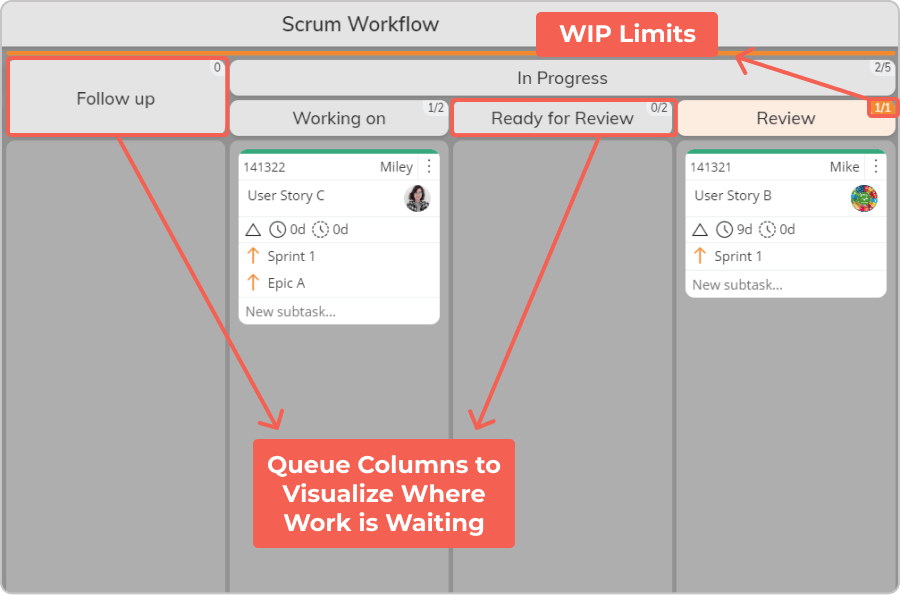
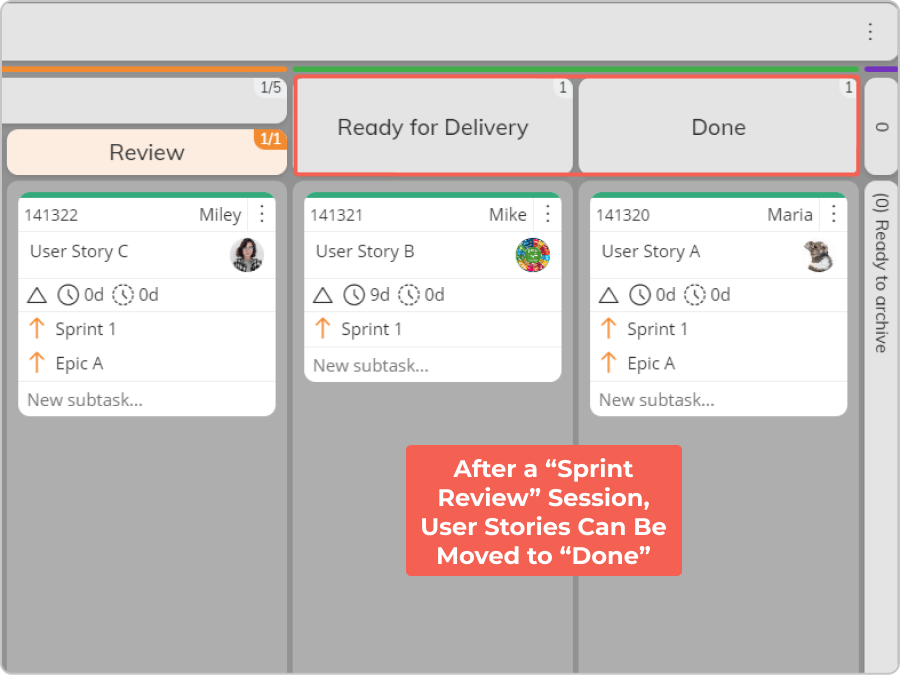
- Done area – The last stage on a Kanban board is the “Done” area, where the teams deliver work. In a Scrum context, there is the “Sprint Review” ceremony that happens at the end of every sprint. To cover that, our suggestion is to break down your Done area into two columns – “Ready for Delivery” and “Done”. The idea with “Ready for Delivery” is to create a second “delivery” commitment point where your Scrum team can continuously gather completed work items. After assessing those user stories in a “Sprint Review” ceremony, you can declare them “done-done” and move them to the “Done” column.
Bringing all pieces together, the design of your Scrum workflow on a Kanban board might look something like this:
Tracking The Progress of Releases, Sprints, and Epics
To create a complete part of a product, Scrum uses release planning sessions with story mapping. Every release consists of several sprints, which are usually broken down into user stories and epics.
So, how can you visualize that structure on your board?
To do so in the software, we stack up multiple workflows on a single board or connect different boards together for a scaled structure.
For example:
- Sprints – On top of your Scrum workflow from above, you can add a timeline workflow and create initiatives to visualize the length of your sprints (ex., 2 weeks). In Businessmap, the system allows you to create a hierarchical structure between different work items through parent-child link relationships, so you can easily connect your user stories to a sprint (or break down the sprint into user stories). This structure helps you automatically track the progress of your sprints as you’re completing user stories.
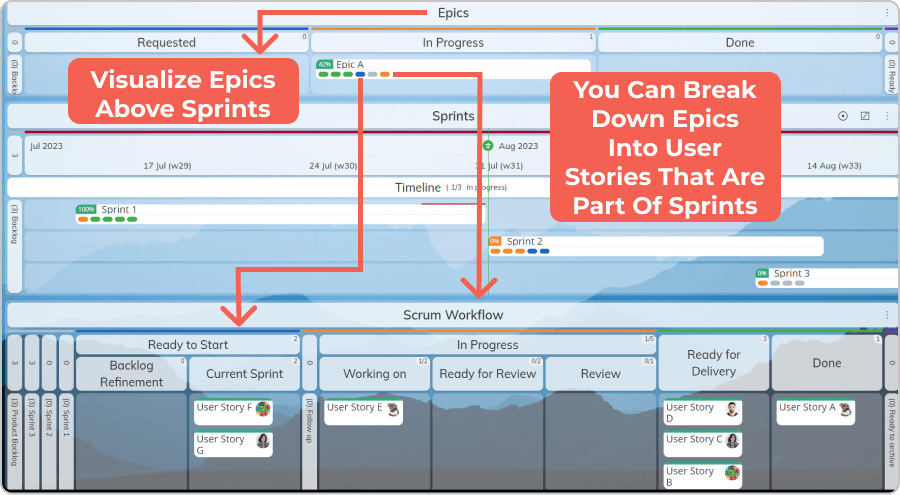
- Epics – By definition, epics are larger user stories that can transcend multiple sprints. There are hundreds of scenarios here, but one possible one is to visualize your epics on top of your sprints in what we call an “Initiatives workflow”. The only difference with a timeline workflow is that the initiative workflow doesn’t contain a planned end date which could be suitable if you don’t know when the epic will be done. Depending on your scenario, you can break down the epic into stories and disperse them across sprints.
- Releases – The goal behind every sprint is to create an increment that contributes to the release of a larger piece of the product. So, each one of your sprints can be connected to larger initiatives such as “Releases” that usually require multiple teams to collaborate on. To put this in practice, you can scale up your Kanban boards to a “Management board” where you can visualize the progress of releases and their connection to sprints across teams.
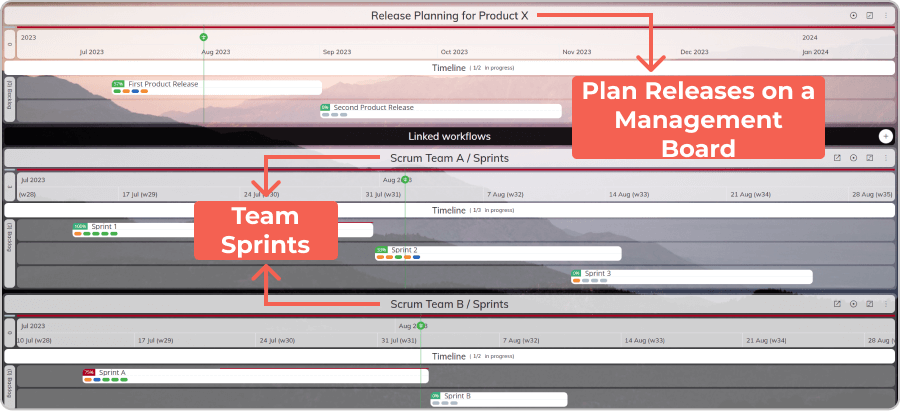
Putting this structure in place lays the foundation of your Scrum process, allowing you to track the progress of work and re-plan your sprints, epics, and releases as necessary.
But when talking about planning, we can’t move on without concerning the story points in Scrum. Combining them with some flow metrics, however, can truly mature your iterative process.
How to Use Story Points and Velocity?
While story points are based on estimations, they are fundamental to the Scrum framework and can be quite useful when you have no historical completion data. However, once you have enough data, our recommendation is to move away from them.
But first, let’s see how you can visualize your story points and track velocity in the platform.
Visualizing Story Points
To set the ground, every card on a board consists of a “size” field where you can visualize your estimations in the following formats:
- Fibonacci sequence (commonly used for story points)
- T-shirt sizes (Note: Keep in mind that the platform calculates the cumulative size of work items inside initiatives/projects. If you’re using T-shirt sizes, the cumulative size will be present as a numeric value. For example, if you have 2 work items with sizes “S” and “M”, the cumulative size in their initiative will be “3” because “S” equals “1” and “M” to “2”).
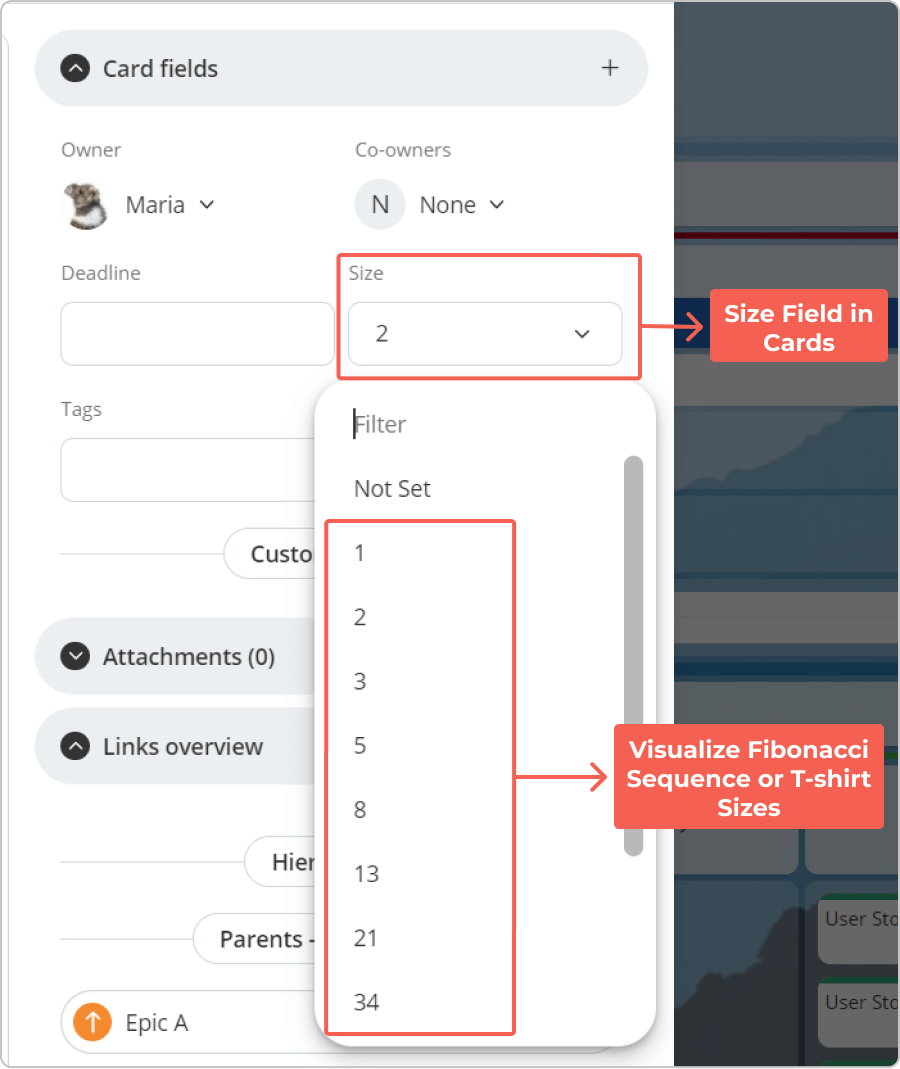
Our advice is to use the “T-shirt” sizes estimations early in the process (ex., in story mapping or writing workshops) when you don’t have sufficient details about the work at hand. Usually, Scrum teams use a practice known as “relative sizing” to group different categories of user stories or epics that “relatively” have the same complexity (ex., have an “XL” size).
As you begin refining and splitting your user stories/epics, it’s better to move to the Fibonacci sequence for estimating. Usually, Scrum teams engage in “planning poker sessions” when refining user stories to create more granular estimates with story points (ex., 1, 2, 3, 5, 8, etc.). The goal here is to set up your velocity and track it over sprints to figure out what you can commit to in a single iteration.
Calculating and Measuring Velocity
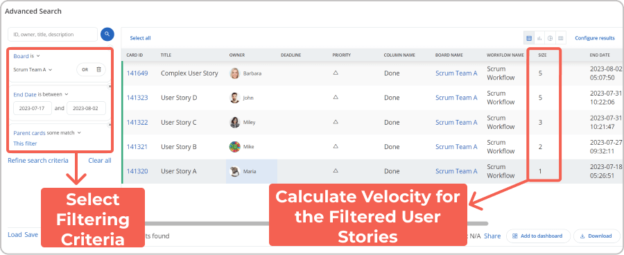
Once you’ve visualized your story points, the software makes it easy to calculate your sprint velocity. To illustrate this, let’s imagine you’ve finished 5 user stories that comprise your sprint, and you’ve assigned the following points to them:
- 1
- 2
- 3
- 5
- 5
With the “Advanced Search” in the platform, you can get results for work items that were finished in a specific period and match a specific filter (ex., Their parent card’s title is “Sprint 1”). Once you configure the search results to include the “size” field, you will see all finished user stories with their story points. Taking the example values from above, you can sum up the story points you’ve delivered for this sprint (1+2+3+5+5) which makes your velocity 16. The same process can be repeated for your next sprints to come up with an average velocity.
In this line of thought, to measure their velocity, including how much work is remaining, Scrum teams use the Burndown chart. And while you can’t replicate it directly from the platform’s UI, the system allows you to export your data from the Advanced Search and create Power BI queries to visualize both planned and remaining work on your project. For better visibility and easy access, you can map the Power BI chart inside a custom dashboard in your account.
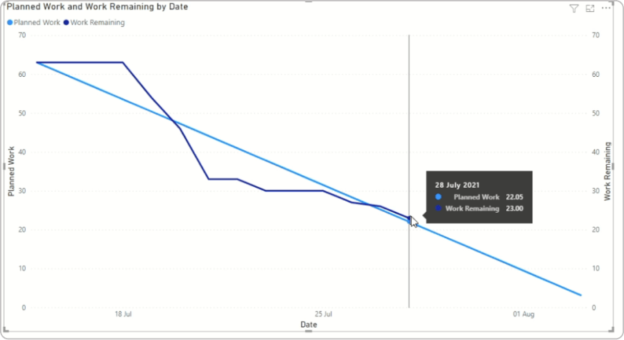
Note: The generated chart from PowerBI is for example purposes only and does not reflect the data mentioned above. To visualize your current data in a Burndown chart and embed it in your dashboard through our platform’s BI solutions integration capabilities, we advise you to contact us for assistance.
Embracing Flow Metrics for Better Planning
As we mentioned earlier, our recommendation is to gradually move away from story points once you have historical data for your iterative process. One of the most common problems we’ve seen with the story points technique is that work items that have been estimated with the same size turn out to have different completion times. This creates confusion about how to estimate work in a volatile environment which leads to unrealistic expectations.
That’s why let’s look at how you can use the flow metrics in Businessmap to embrace data-driven Agile planning in a Scrum environment.
Tracking Cycle Time, Throughput, and WIP in Your Sprints
In case you are not familiar with these metrics:
- Cycle time: the amount of time someone spent working on a user story
- Throughput: how many user stories the team delivered in a specific period
- WIP: how many user stories do you currently have in progress
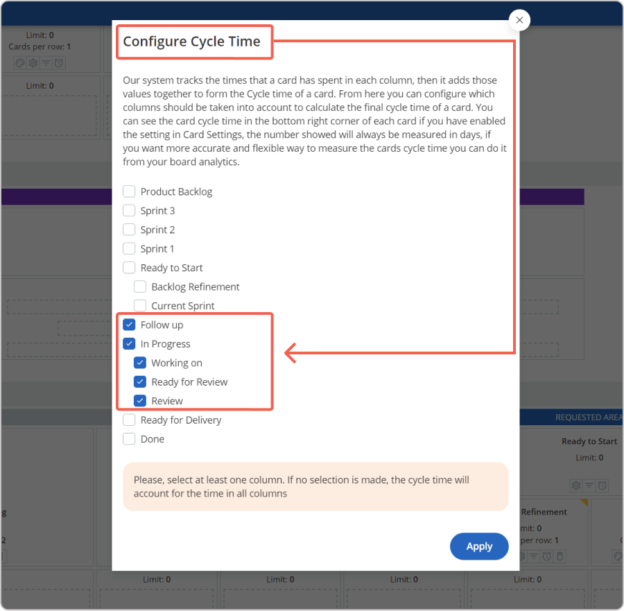
In Businessmap, you can define which columns on your board to track cycle time. Let’s suppose you’ve done that for the entire “In Progress” area, and you’ve collected data across a couple of sprints.
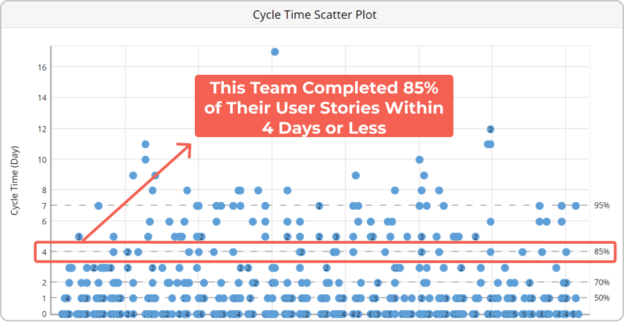
With a Lean/ Kanban chart such as the “Cycle Time Scatterplot”, you can filter to see the completed user stories for a specific period and then derive probabilities of how long it takes to deliver a single work item. For example, based on the data in the image below, there is an 85% chance for a user story to take 4 days or less to complete.
Beyond that, the “Throughput Run Chart” allows you to track your delivery rate. If you filter your data across several sprints, the chart gives you information about how many user stories you’ve been able to deliver on a weekly basis. If you’re running 2-week sprints, you can sum up the completed user stories from both weeks to find your throughput for that iteration.
Combining insights from both charts is useful to realistically determine what amount of work can fit in a single sprint based on your performance so far.
What About WIP?
Throughout the article, you might’ve noticed that we haven’t mentioned one particular ceremony which is essential for a Scrum process. That’s the Daily Scrum.
But what does Daily Scrum have to do with WIP?
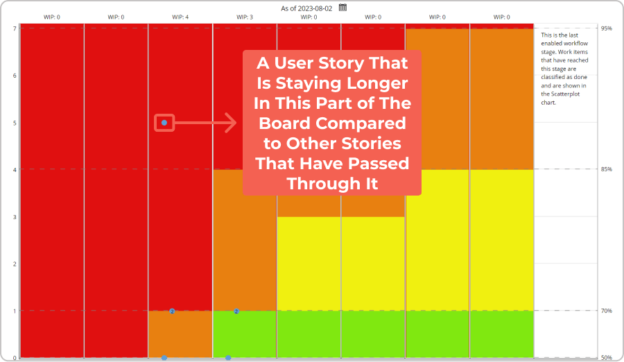
Beyond answering the most common questions in a stand-up meeting, we believe it’s equally valuable to track WIP aging in your system. Applying this practice reveals user stories that take more than usual to complete. Hence, you can spot specific work items that might endanger your sprint plan.
In practice, the system helps you do that with the WIP Aging chart, which is a representation of the work that is currently in progress. With a quick glance during a daily scrum meeting, you can see how the current user stories are flowing through the sprint compared to your historical performance. Pay attention to items in the red part of the chart because that is an indication they’re in danger of finishing late.
Forecasting Sprints, Releases, and Projects
So, what can you do with all that data?
Tracking specifically your throughput and cycle time in the work management system opens the door to forecasting the delivery of future sprints, releases, or projects through the Monte Carlo Simulations.
Let’s see how.
In the software, there are two types of forecasting simulations:
- Monte Carlo: How Many: gives you insights on how many work items you can deliver in a predefined period
- Monte Carlo: When: gives you insights into when you can deliver a predefined amount of work items.
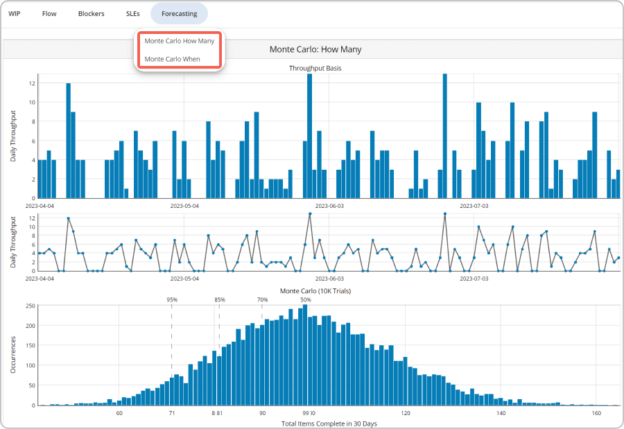
To put this into perspective, based on your accumulated sprint delivery data, you can access the “Monte Carlo: How Many” simulation and see how many user stories you can plan to deliver in the next 2-week sprint (14 days) with a given certainty (ex. 50%, 70%, 85% or 95%).
The same applies to your releases or projects.
For example, imagine that you’ve identified you need to complete 50 user stories to release an early version of your product. The Marketing team is wondering whether that could be done in the next 3 months, so they can present the release at an event. In this scenario, you can instruct the “Monte Carlo: When” simulation to forecast what date those 50 work items would be done by.
Based on the 85th or 95th percentile (in a case where you have a specific deadline, our recommendation is to look at the highest percentile), you can define whether that’s possible, considering your team’s available capacity.
Key Takeaways and Next Steps
Even though we’d like to provide you with as many details as possible, a single article is far from enough. However, if there is one key takeaway, it’s that a Scrum process can be successfully combined with flow metrics to enhance your project planning and delivery capabilities.
With the risk of being biased, we will say that our platform has the means to make that a reality. So, in case you haven’t started your free trial yet, we invite you to explore the platform and set up your sprints.
If you have any questions or struggles along the way, just let us know. We’re here to help you!

Nikolay Tsonev
Product Marketing | PMI Agile | SAFe Agilist certified
Nick is passionate about product marketing and business development and is a subject matter expert at Businessmap. With expertise in OKRs, strategy execution, Agile, and Kanban, he continues to drive his interest in continuous improvement. Nick is a PMI Agile and SAFe Agilist certified practitioner.