-
Product
Businessmap SOFTWARE PLATFORM (formerly Kanbanize)
- WATCH FULL PRODUCT DEMO Discover the most flexible software platform for outcomes-driven enterprise agility.
- OKRs Implement OKRs and align your strategy with day-to-day execution
- Workspace management Distribute and track work across the entire organization
- Management dashboards Monitor business objectives, understand risks, and track the most important performance metrics
- Workflow management Keep your teams' work in a single place with multi-layered Kanban boards
- Kanban boards Keep track of tasks and get accurate status reports in real-time
- Interlinked boards Create a network of interlinked Kanban boards on a team and management level
- Timelines Visualize your past, current, and future initiatives or projects
- Dashboards & reporting Display critical business metrics and gather reports in one place
- Dependency management Visualize and track cross-team dependencies via card links
- Kanban card functions Customize your work items as needed and enhance communication
- Project forecasting Create probabilistic plans for future project delivery
- Business rules Automate your process to trigger actions when certain events occur
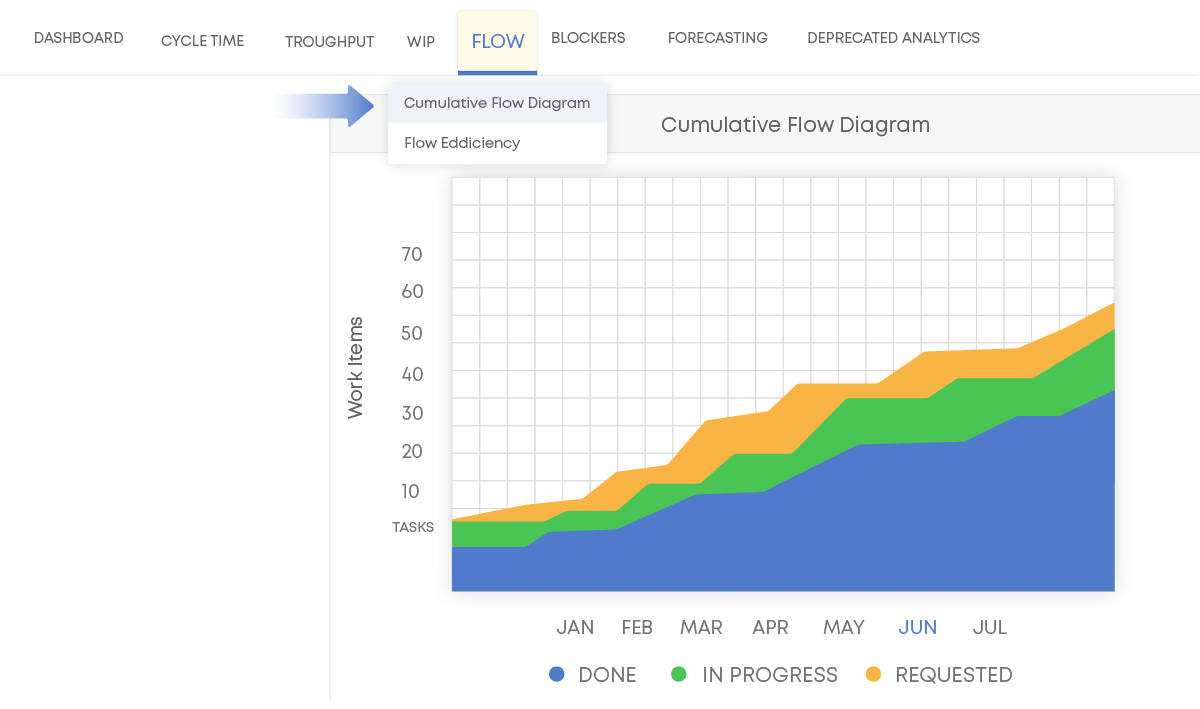
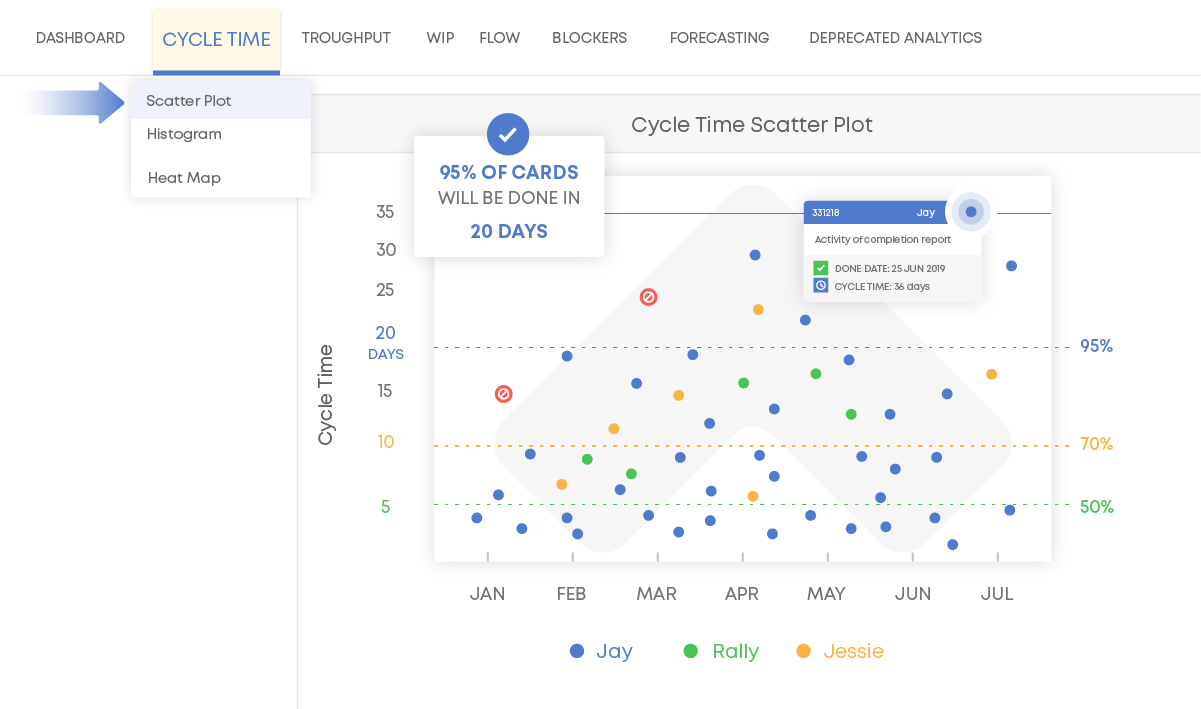
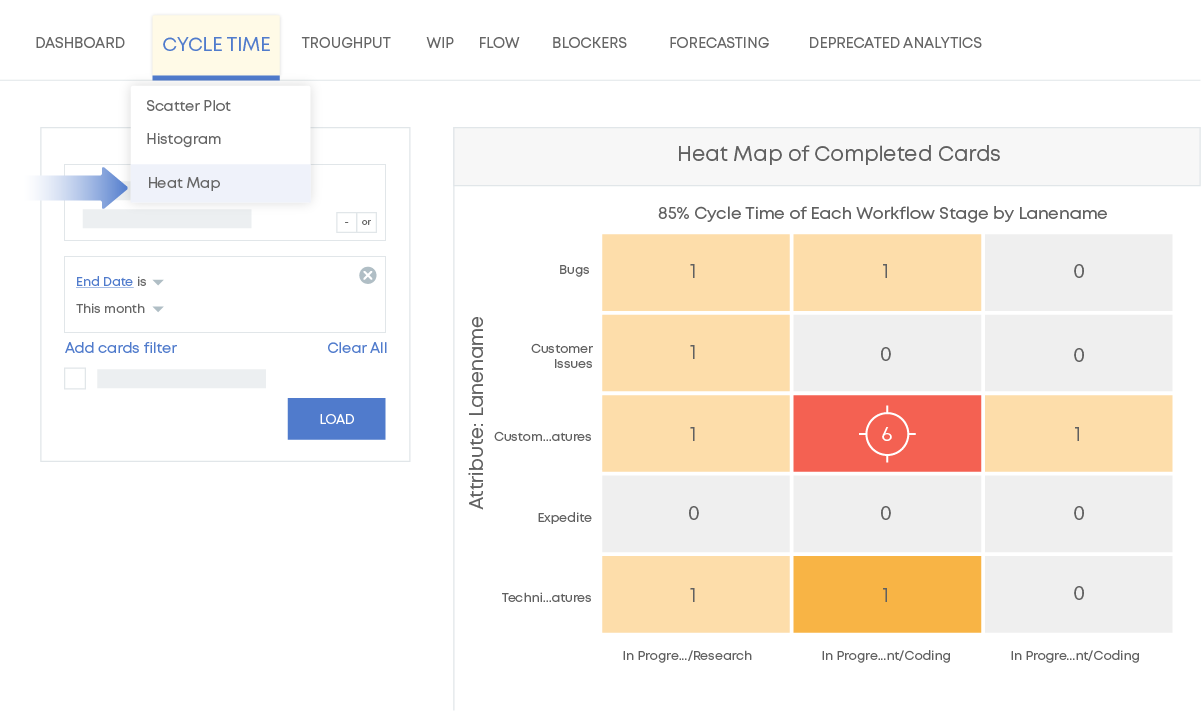
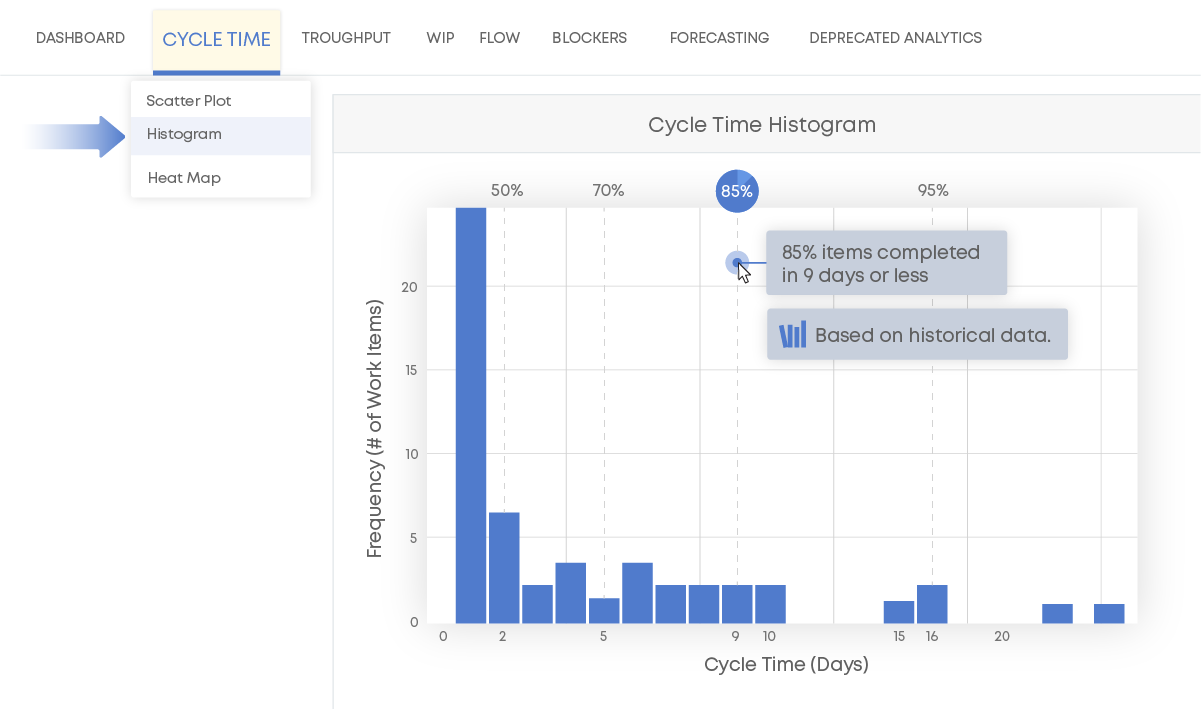
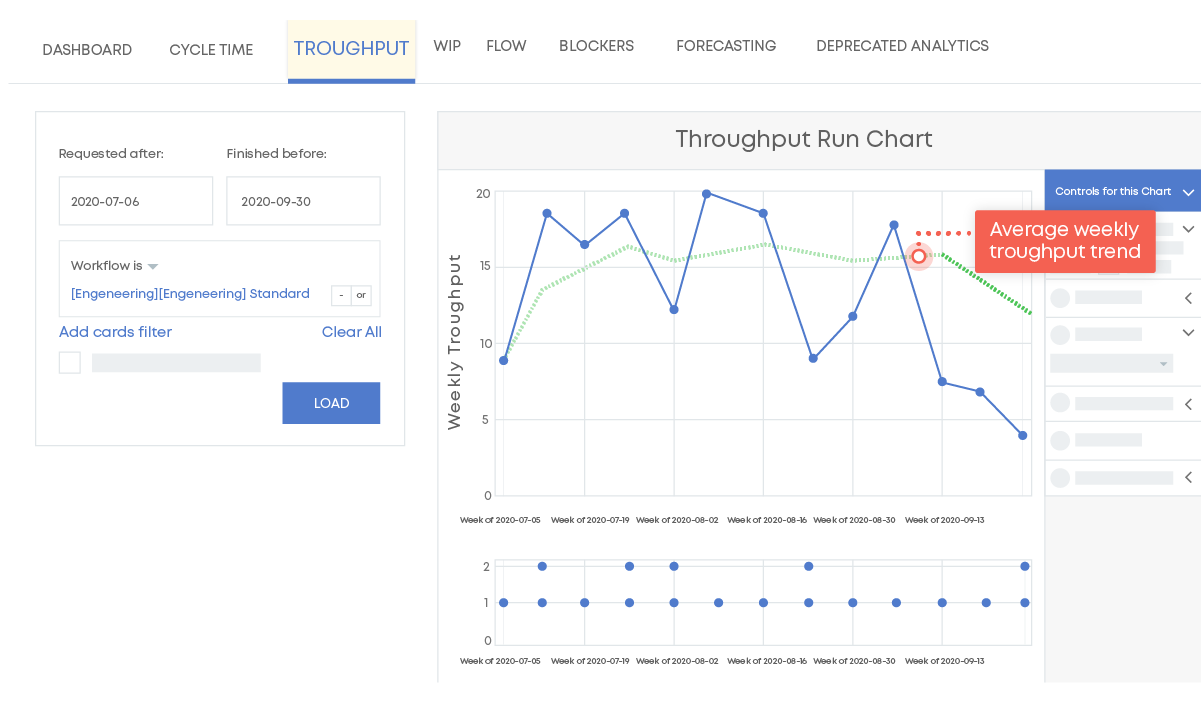
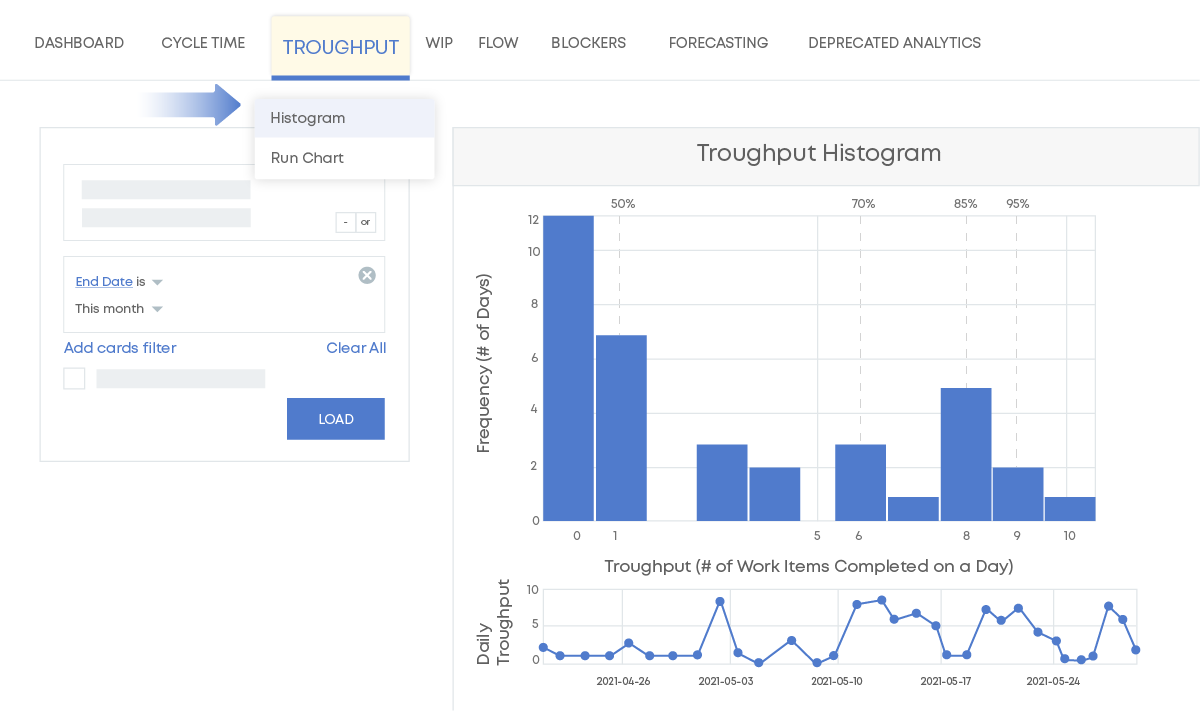
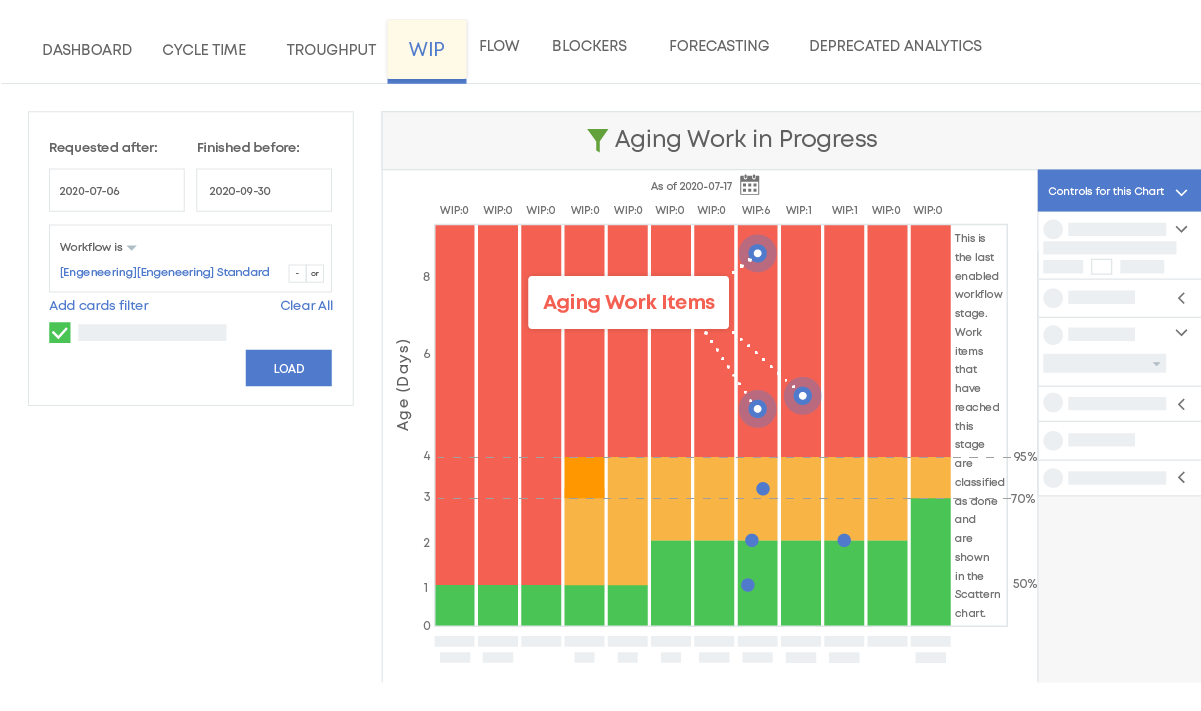
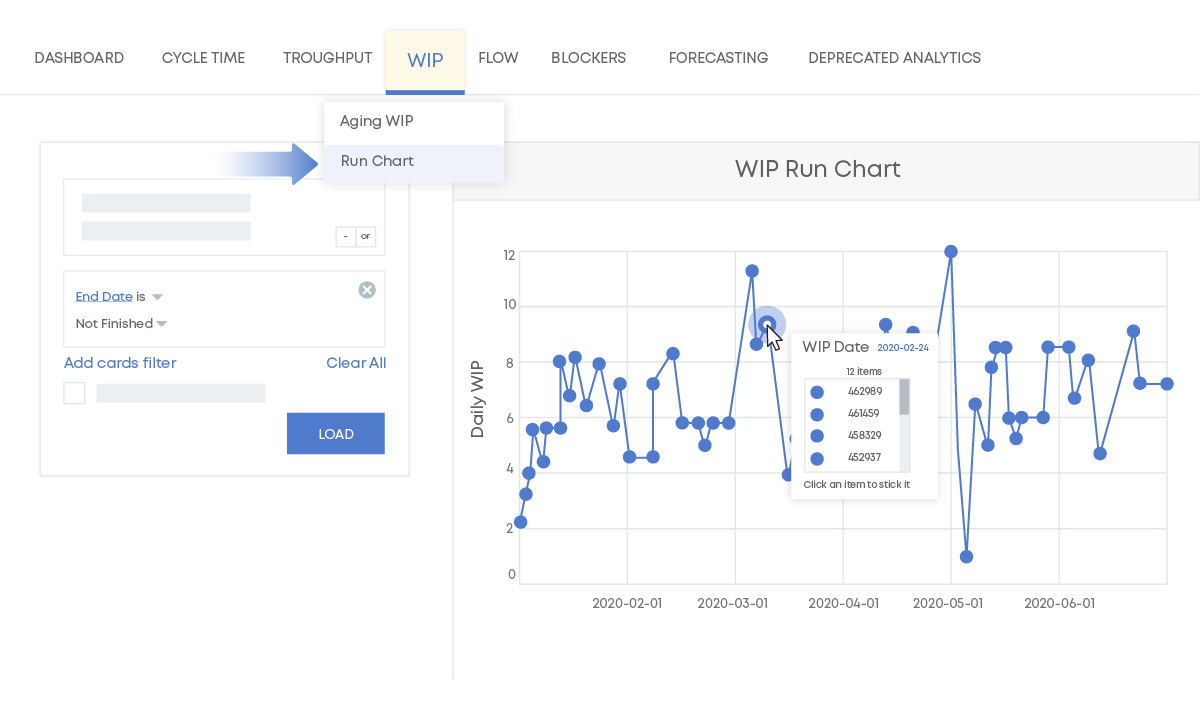
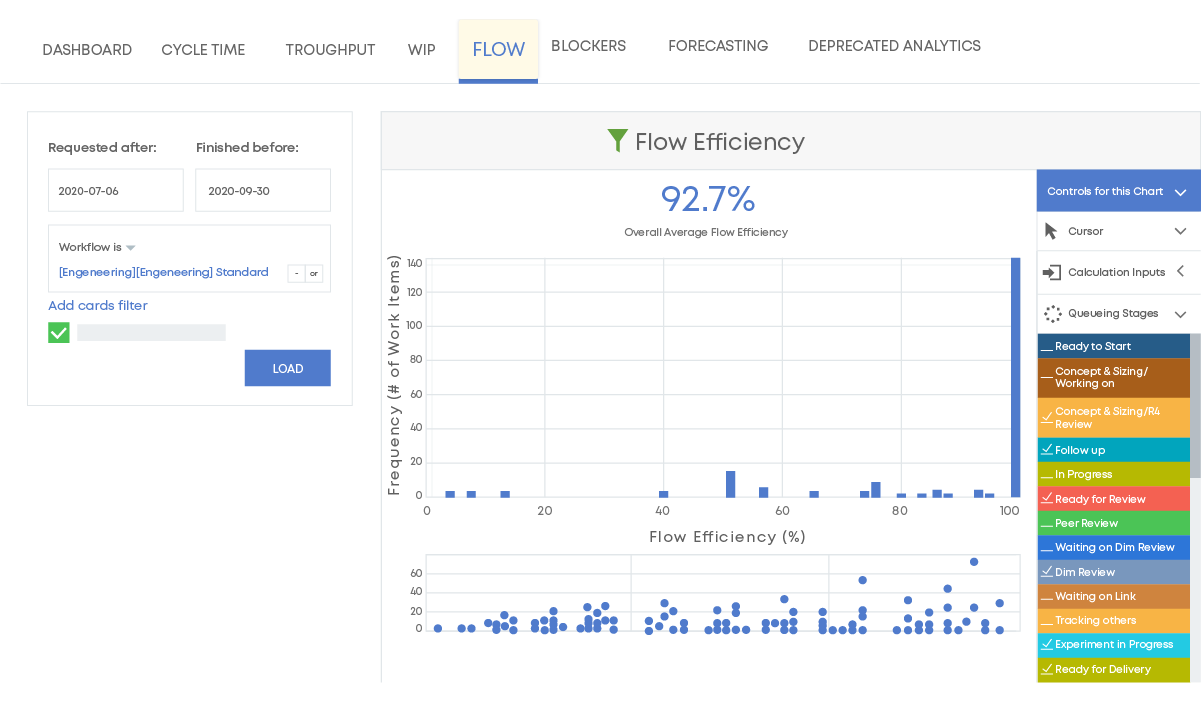
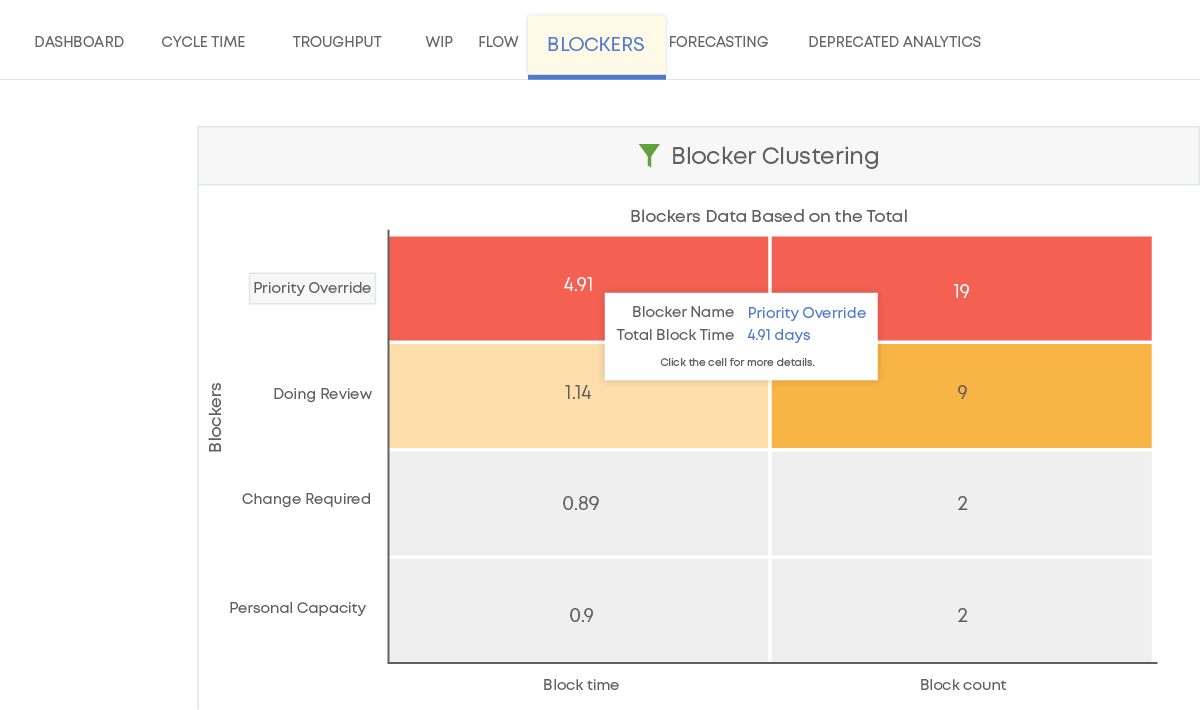
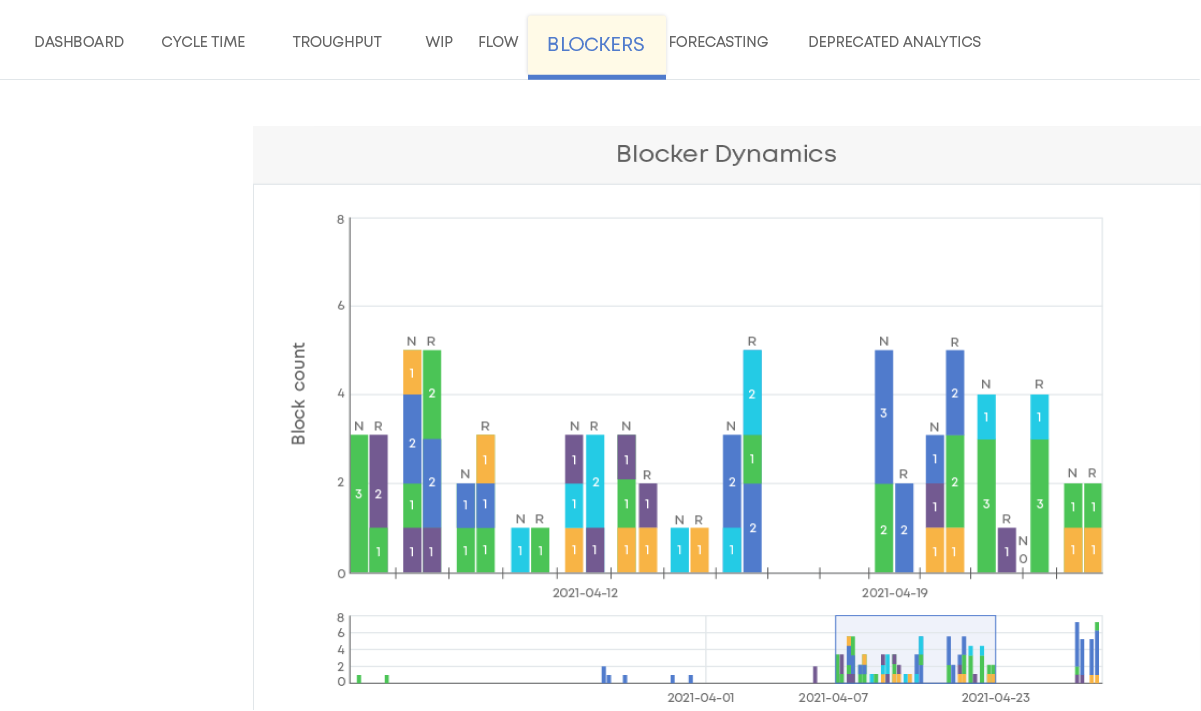
- Workflow analytics Analyze your workflow’s performance through a variety of Lean/Agile charts
- Limiting work in progress Reduce multitasking, alleviate bottlenecks, and keep a steady flow of work
- Integrations Integrate with external systems to get the most out of your Kanban software
- Email integration Create and update cards via email and reply to emails by adding a comment
- API Integrate with external systems with our REST API
- See all functionalities
-
Solutions
BY USE CASEBY INDUSTRY
- Aerospace Optimize the development of aircraft engines & avionics systems
- Architecture & Construction Facilitate communication and optimize workflows across all teams
- Pharmaceutical Enhance the flow of medical development and testing processes
- Mechanical & Industrial Engineering Visualize the flow of industrial products from design to production
- Chemicals Enhance production efficiency in the chemical industry
- Computer Software Release features faster to production & embrace data-driven planning
- Financial Services/Banking Empower digital transformation in financial institutions
- IT Services Meet customer expectations & deliver IT services efficiently
-
Partners
Partner services
- PPM Ops Program Develop your organization’s skills to successfully adapt to changes, achieve outcomes at scale and grow a culture of collaboration.
- PPM Ops Foundations Course Sharpen your ability to visualize strategic initiatives and align company goals across every single team.
- PPM Ops Assessment Evaluate your management practices and get a personalized roadmap for achieving your company goals.
- Integrations Secure the integration of Businessmap with your preferred applications, tools, or services with our experienced partners
- Implementation Work with an experienced partner with a proven history of successful Businessmap deployments
- Pricing
- Enterprise
-
Resources
Helpful Resources
- See full product demo Discover the most flexible software platform for outcomes-driven enterprise agility.
- Businessmap Academy Dive into Lean/Agile with dedicated courses
- Case Studies Read customer success stories from all around the globe
- Businessmap Blog Discover the latest Businessmap news, get helpful content and actionable tips
- Knowledge Base Configure our software platform and keep track of new product updates
- Kanban Simulation Get to know Kanban in a simulation environment