The thing I often stumble upon, as a coach and consultant, is that many teams don't track any metrics. Nothing. Ah, well, sometimes the digital tool they use tracks stuff for them. But then they don't look at it, don't understand it (because they didn't create it), or it's broken due to lots of old tickets flowing around.
This fascinates me because it means that they don't know how their process is performing. Also, it's so easy to do. In fact, I argue that by counting the number of items on their kanban board each day, they could gather a lot of interesting process data. If you are in a similar situation, it will help you improve, or at least see if you're improving or not.
In this post, I wanted to share one of those metrics: queue length.
Obligatory Disclaimer: This Is Not the Data You Are Looking for
We are not going to track data about our process. That is not what our customers are looking for. It's a bit like tracking the RPM (Revolutions Per Minute) in a car. Sure, it's interesting to see how the motor is doing, but as long as I haven't put a gear in and is steering in the right direction... I'm not reaching my goal.
What I'm saying is that we are going to talk about a proxy variable. It's showing us how our process is doing, which indirectly means that we are doing great (delivering value faster). But since we are not tracking the real value, we don't know.
We might be delivering crappy things fast.
We need both process metrics and indicators of the true value we are delivering.
Queue Length
Earlier this year, I read the excellent book "Principles of Product Development Flow", by Donald Reinertsen. It is packed with advice and suggestions, and one that caught my attention was to track queue length. The book talks about physical products mostly, but there are many learnings to be made in the IT business too.
Queue length is so obvious, really, but I have never tracked that as a separate metric before I read this book. By tracking queue length, we can understand how much work is locked in our process, in waiting stages, etc. Note that, from the view of the customer, this work is actually in our process already. It's part of the lead time of the work.
Making our queues shorter is a very cheap and simple way to ensure that our work is growing faster. For example, if we only allowed for 4 items in the "To do" column of our kanban board, work would not wait for long before we started it. If the column instead has 40 items, our customer will wait for quite some time.
We can, of course, track queues anywhere in our process. Is there a queue for deployment, for example? Or UAT? All of those places in our process could be worth considering.
When I think about it: how about tracking the total number of items on our kanban board as the total queue of our development process?
How to Track It
This is almost embarrassing to write: just count the number of items in the queue we are interested in. Let's, for the sake of making this post easier to follow, just track the number of items in our "To do" column (or whatever you might call it).
The process metrics that we track are meant to help us improve - we are measuring to learn. Individual numbers are not particularly good for that, so we want to track this over time. This is very easy, of course, as you just need to count the number of items in the column each day. After the morning meeting, maybe?
Create a spreadsheet (you can have mine) with columns like this:
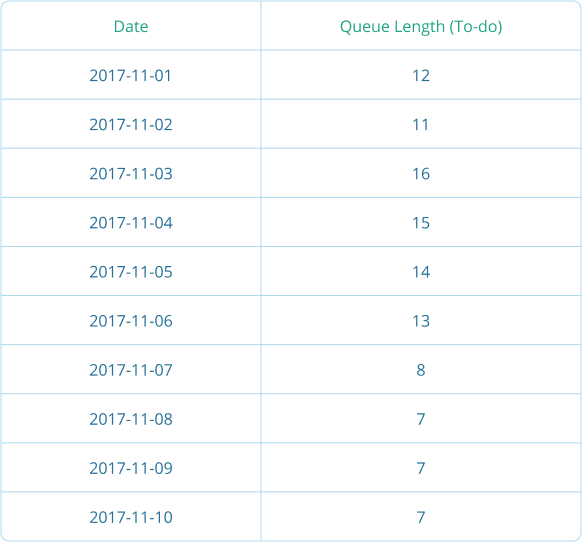 And now, you can easily create a diagram from that data that looks like this:
 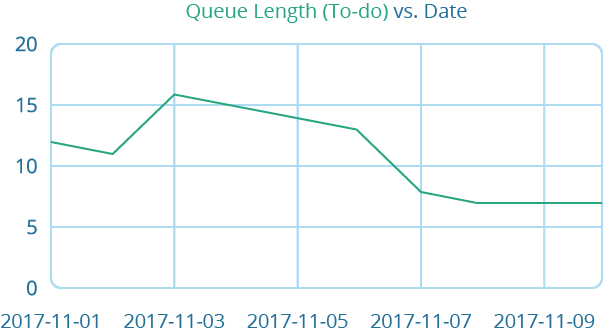 You can, of course, go old-school and just plot it on a graph right on your kanban board. I've often found that, at least, it is easy and useful. Also it has the added benefit of being ever-present close to your board.
A metric without a target will soon be forgotten. Add one by just drawing a line across the graph. Do this in your spreadsheet by adding a column with the target. Having just a column with repeated numbers is a bit crude but has the added benefit of being able to change the target and have the history displayed. I've shown that trait in the example below. 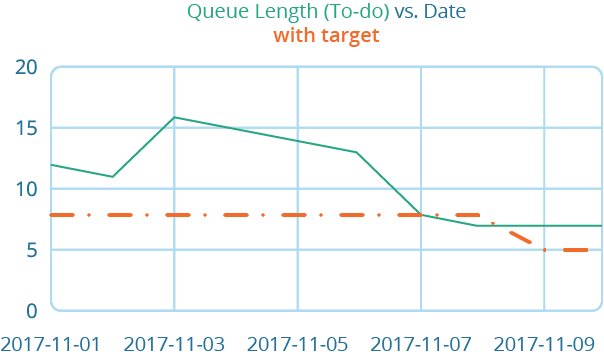 One final trick that I used on one team to make the metric a bit more relevant and interesting is to track how long it would take to clean out the queue.
If you are tracking lead time (SUPER simple: add date for "on the board" and "entered the Done column", track the difference in days)...now if you are doing that...then this is very simple to track. Just add the average lead time to each row in a new column. Then make a new column where you simply multiply the lead time with the queue length. Like this:
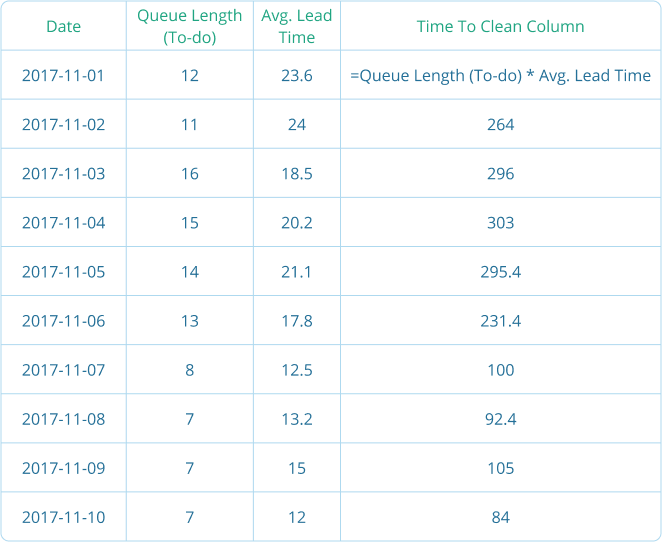 Now you can start to see how long it would take to clean out the column if you didn't add anything. Counting like this is not perfectly accurate since we're not taking into account that you are only doing more than one thing at the same time.
Summary
Shortening queues is a very simple and cheap way to reduce lead time and increase agility in your process. Tracking queue length is a very easy thing to do: just count the number of items in your queue each day. Use the data to make better, informed, data-driven decisions when you improve your process. In your Agile retrospectives, for example.
Till next time - happy kanban-ing!

Marcus Hammarberg
Guest Author
Marcus Hammarberg (LinkedIn) is a Lean & Agile coach. Get agile to work in practice - is his motto. This led him to take an interest in all kinds of things: Kanban, Lean, TDD, and Specification, by example, Node, Continuous Delivery, Nancy, RiotJs, and Koa. You can read more articles by Marcus on his blog - http://www.marcusoft.net/.