Key Results
- 54% cycle time improvement while decreasing lead time by 23%
- 21% improvement in block time with their 3rd party suppliers within the last 4 months
- Achieved full work transparency across all levels (Project, feature, activity)
Introduction
AK Gida (a Group Lactalis company) is the biggest producer of milk and dairy products in Turkey. The company manufactures and markets a wide range of products including milk, kefir, fresh cheese, and ready-to-eat pudding – under the brand name İçim. AK Gida is headquartered in Istanbul and operates 6 plants nationwide.
To learn more about AK Gida’s case, we talked to our partner Murat Elmas from AgileMind, who consulted the manufacturer on their Lean/Agile transformation journey.
But before we go there, let’s see how everything started.
Backstory & Initial Challenges
The story begins in the company’s IT department, which consists of around 40 people. Looking for a way to speed up delivery processes, the company’s CIO – Mehmet Belgen identified several challenges in their current ways of working.
The main ones included:
- Low organizational transparency
- Scattered project activities across systems
- Internal and external dependencies were causing delays
- The need to manage multiple internal and external projects simultaneously
To alleviate those problems, Mehmet turned to Lean/Agile ways of working.
From Scattered Work to Embracing a Hybrid Approach with Businessmap
After the initial conversation between Murat from AgileMind and the CIO, they agreed on moving forward with 3 main focus areas:
- Applying Lean/Agile practices to overcome functional silos and lack of collaboration
- Digitalizing work (projects, features, activities) to gain a better overview of the entire value stream
- Managing internal and external dependencies by creating transparent data-based analysis
Regarding applying Lean/Agile ways of working, the IT department’s first step was understanding their current process and identifying different work types. This was done with the help of multiple workshops on practices such as Value Stream Mapping (VSM) and STATIK (Systems Thinking Approach to Implementing Kanban).
As a result, the IT department separated 2 main areas for their service delivery:
- A process for gathering and synthesizing new requests from the business units
- The main process for managing projects and delivering the actual work
After several collaborative sessions, the teams representing those areas agreed on using a hybrid approach with both iteration and flow-based practices.
For example, they implemented the Kanban method for the analysis of new requests and management of projects. On the other hand, they started delivering the actual work iteratively in 2-week sprints by using the Scrum framework. To gather feedback, they also engaged in regular feedback loops such as Daily Stand-up Meetings and Retrospectives.
To implement this hybrid approach in practice and achieve visualization across multiple hierarchical levels of work, AK Gida turned to Businessmap.
Applying the Businessmap Platform to Manage End-to-End Service Delivery
Starting From Upstream Workflows
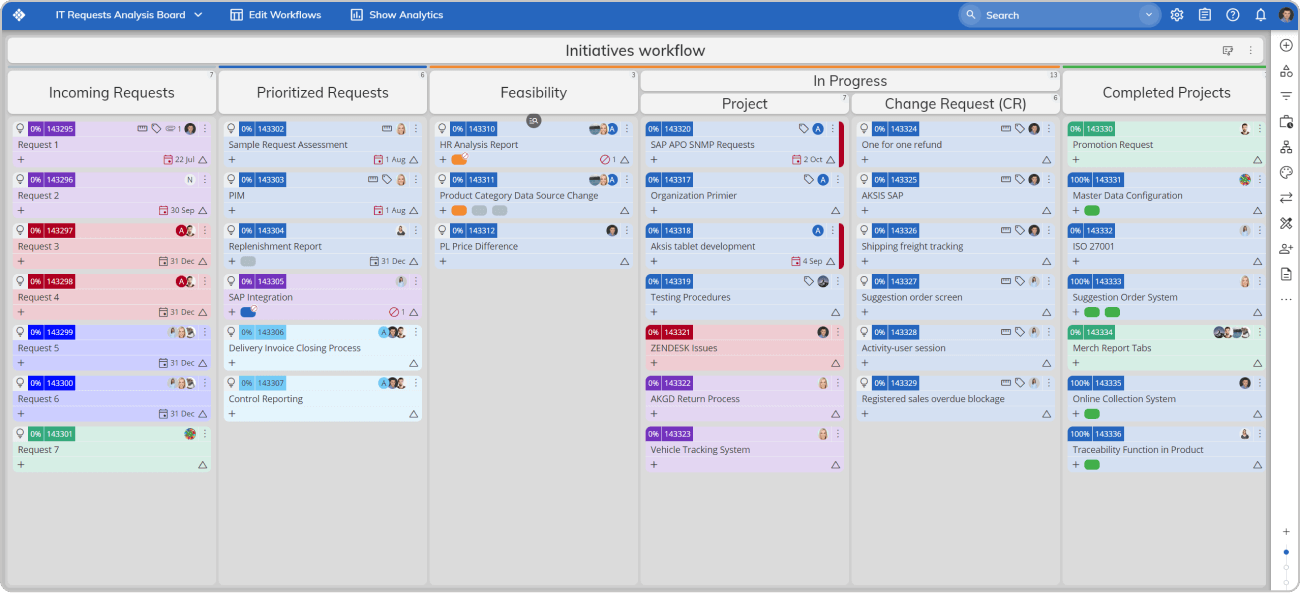
The first service that the IT department visualized inside the Businessmap platform was the process of gathering new requests from other business units. With the help of a dedicated board, the team structured a workflow that serves as a “pool of ideas”. This created an Upstream Kanban implementation within the department where every request goes through a set of analysis steps to determine whether it is a project or a smaller activity such as a “Change Request”.
Implementing a Work Breakdown Structure & Managing Projects
After a request is turned into a project or a Change Request, the work moves to the main “Department” board in Businessmap.
This board is more sophisticated as it houses 3 levels of work:
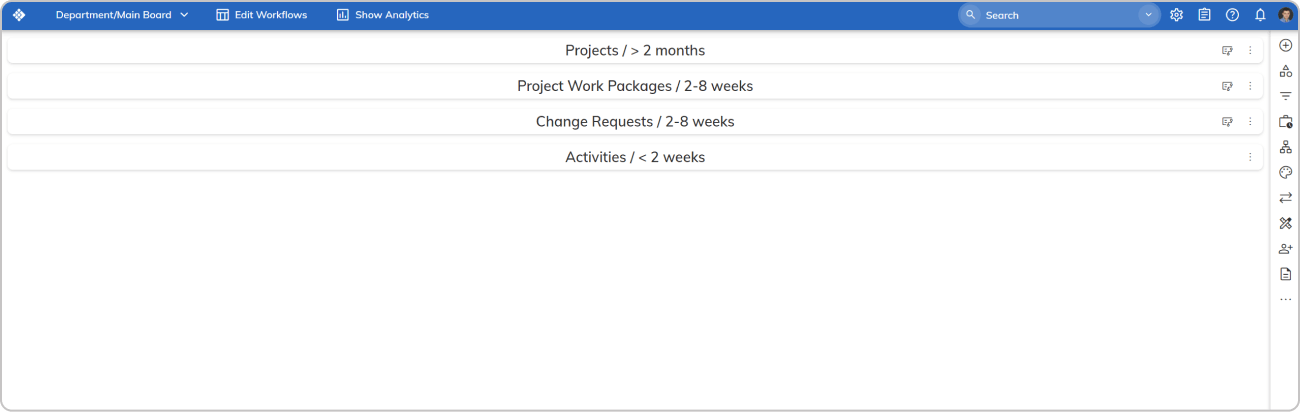
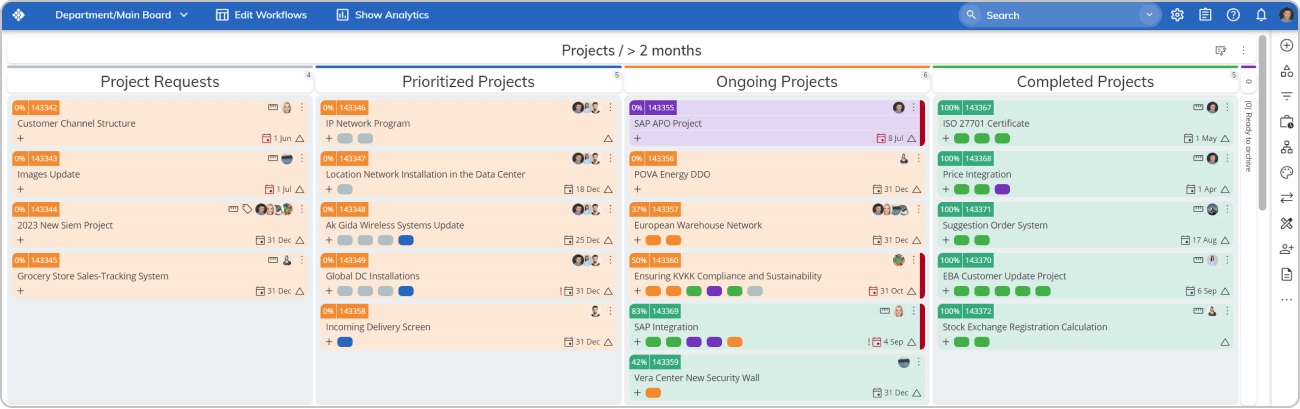
- “Project Level” where all project-related requests from other business units go through. The teams agreed that they would turn any requests into a project if it took more than 2 months.
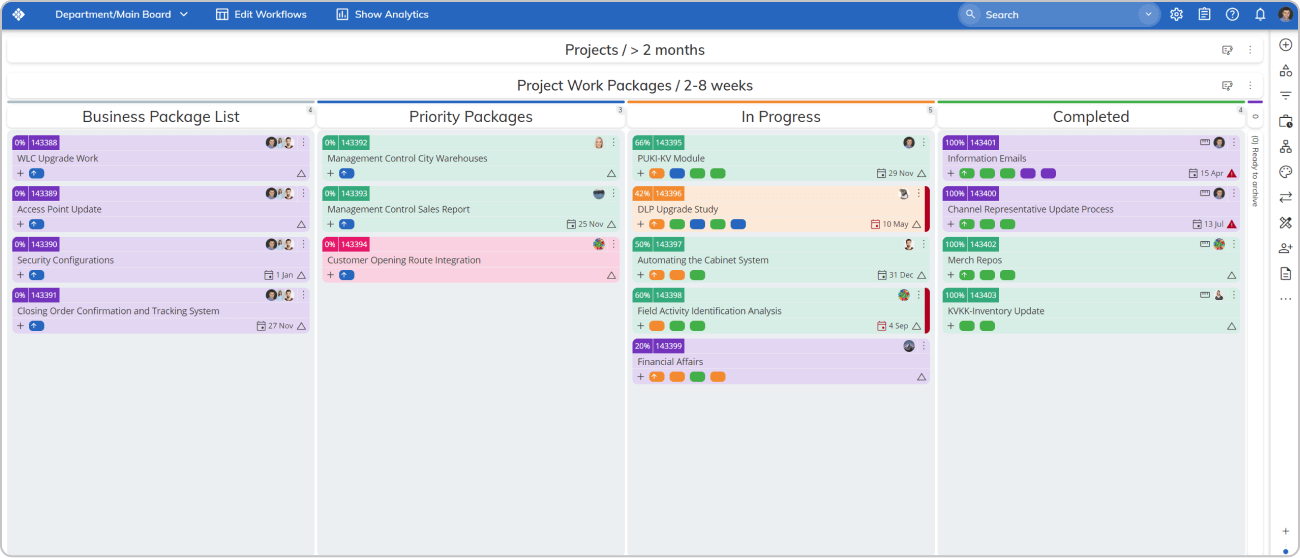
- “Packages & Change Request Level” where all smaller projects, change requests or deliverables that take between 2 weeks and 2 months live.
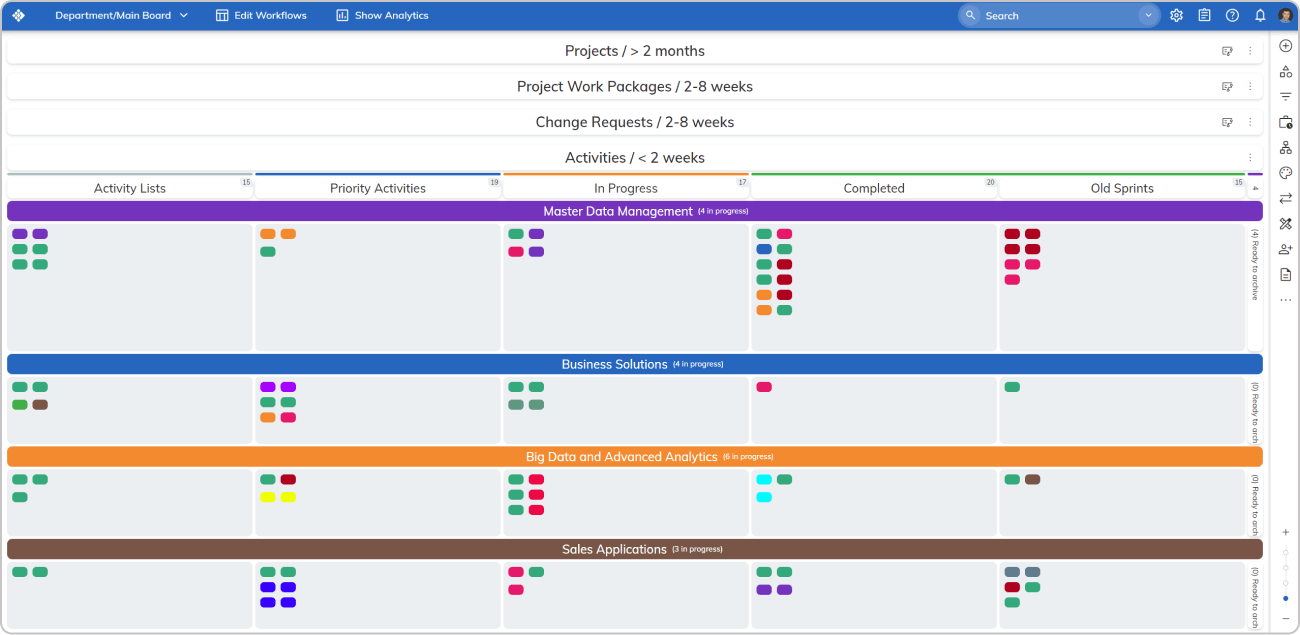
- “Activities Level” which serves as the flow for daily task management. All work activities here are children of smaller change requests or larger projects and shouldn’t take more than 2 weeks.
As a result of this structure, the IT department gained transparency over their projects in a central place. Now, both the CIO and project managers can easily see who is working on what and where the work is coming from.
Managing External Dependencies Through Blockers Analysis
As we mentioned above, one of the major pains at AK Gida’s IT areas was the inability to properly manage dependencies. Even though engineers started building “queue columns” on the Department board to visualize external dependencies, it was difficult to analyze which vendor was breaking their SLA (Service Level Agreement).
That’s when Murat from AgileMinds proposed the idea to create a blocker that represents every single vendor on the Department board. As a result, IT engineers started blocking their work on the board once it was waiting on an external vendor.
This allowed them to analyze which dependency delays a project the most through the “Blocker Clustering” chart in Businessmap.
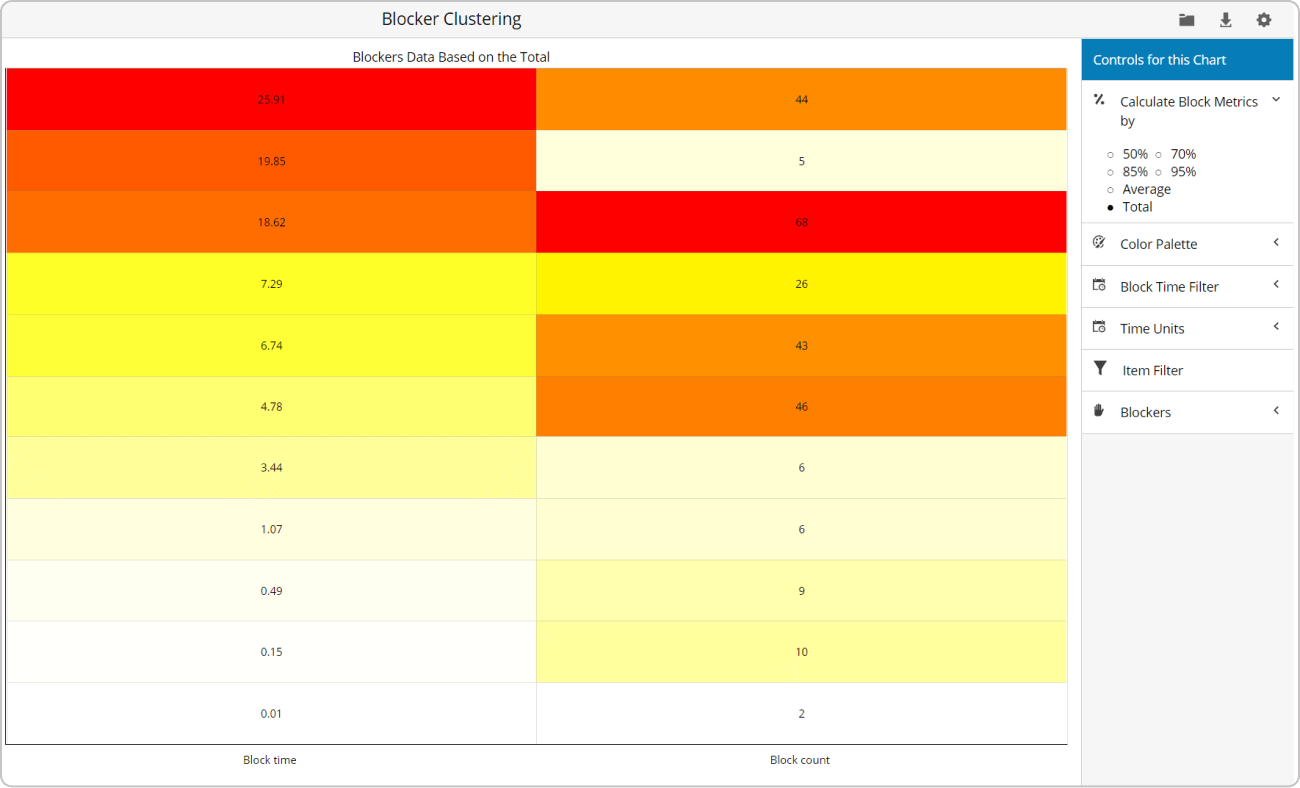
Eventually, AK Gida engaged their suppliers in data-driven conversation to manage those dependencies and improve continuously.
Utilizing Lean/Agile Analytics for Continuous Improvement
Any Lean/Agile transformation would be incomplete if it’s not properly measured.
That’s why AK Gida’s IT department began utilizing the wide range of Analytics on the Businessmap platform to measure the efficiency of their processes after the new ways of working.
Their primary focus is flow-based metrics such as lead time, cycle time, and throughput to measure the IT department’s delivery capabilities.
For example, to analyze lead and cycle times, the IT engineers utilized the Cycle Time Scatterplot.
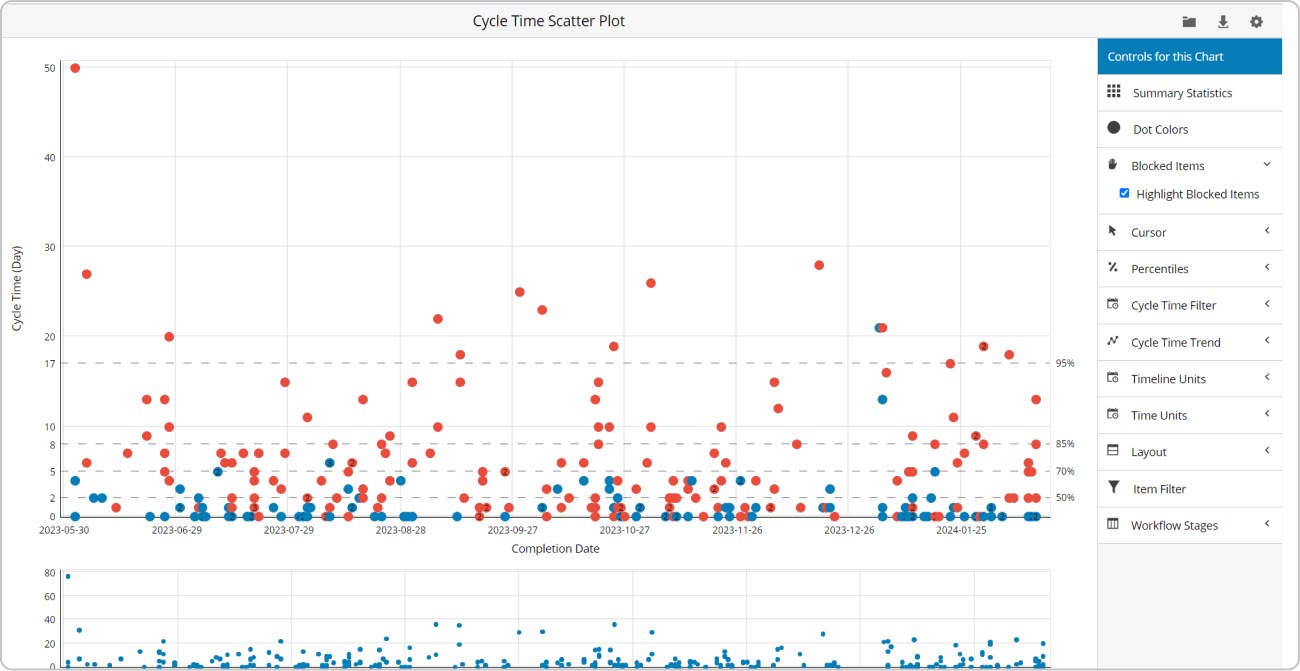
With its help, they get probabilities of how long it takes for 85% or 95% of the items to flow through the process. That’s how they set up SLEs (Service Level Expectations) for incoming work.
On the other hand, for a complete overview of the entire workflow’s performance, the CIO found the “Workflow Summary Performance” dashboard inside the platform extremely helpful.
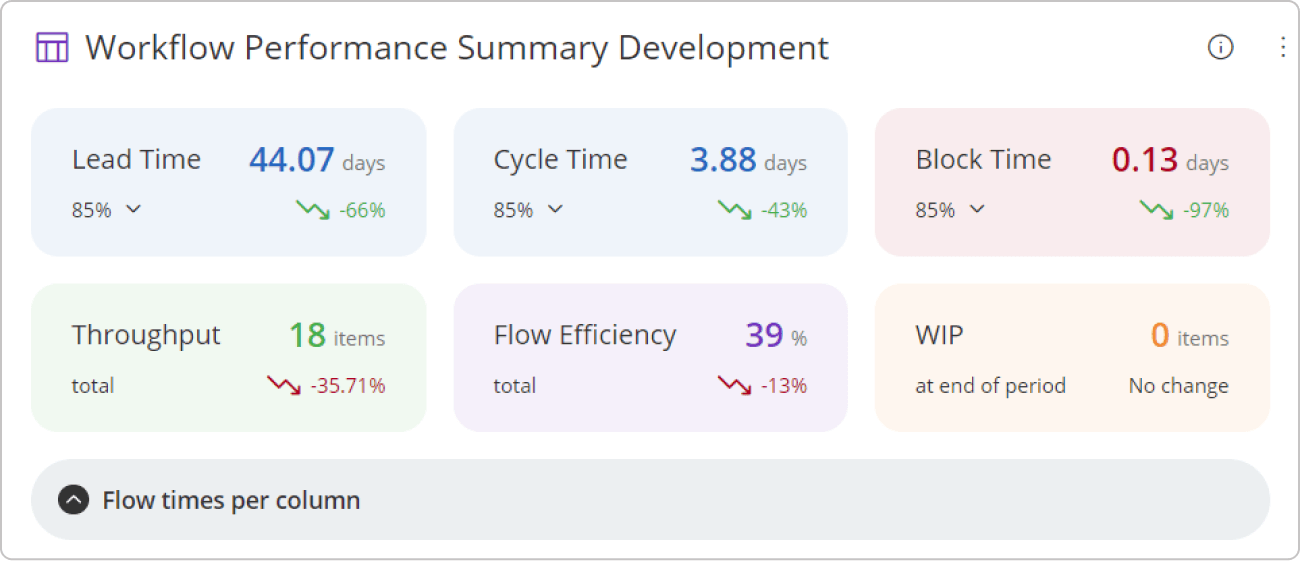
This allows senior managers to inspect how the main service delivery metrics are progressing compared to a previous period.
Future Plans
As the company is committed to continuous improvement, AK Gida is now looking to implement Lean/Agile ways of working combined with the Businessmap platform across other business units.