Virtually all companies use Key Performance Indicators (KPIs), but too many are measuring the wrong things. The result is wasted effort and misdirection because choosing the wrong metrics rewards the wrong behaviors.
U.S. banking giant Wells Fargo learned this the hard way. They incentivized associates based on a key metric: the number of accounts opened. In their rush to boost their metrics, some associates opened fraudulent accounts. The result was disastrous legal trouble that gave the company a black eye from which it's still struggling to recover.
What you measure is what you will get. This is why you need to measure the behaviors that drive the outcomes you want to create.
What Are Predictive Metrics?
In many cases, companies take the wrong approach to metrics because they measure only results obtained over a long period of time. For example, take a KPI like "Percent revenue from new products released in the past five years."
Its time horizon is five long years, and it is only relevant to update it once a year. It is a fine KPI for gauging product development performance, but if all you measure are these long-term performance metrics, you're missing an opportunity to use metrics to drive behaviors that predict where your company will be in five years.
An alternative approach is to supplement the standard performance metrics with predictive metrics. This type of metric measures not a result, but a driver of behavior. It is more process-oriented than performance-oriented. Predictive metrics are leading indicators that show that you are creating the outcome you want to create day-by-day and month-to-month.
Predictive Metrics: Example
Here's an example.
A leading tech firm created a superb new product development process, but adoption was slow. How could they promote the adoption of the process and see that it was taking hold? They chose to use continuous improvement metrics and measure the behaviors that indicated that teams were adopting the new process.
As teams wrote new development plans, they measured the number of these plans that used the new process vocabulary. This metric could predict the rate of process adoption. The more dev plans that contained the new product development process vocabulary, the greater the extent of the adoption.
This metric measured a behavior ("use of new process vocabulary") that could predict a result ("process adoption"). It was a measurement taken along the way rather than at the end of a long course of development. The company could have waited a year or two and then counted the number of teams that complied with the new process. However, that was not a continuous improvement metric that could predict the result they wanted to achieve.
Measurements taken during the course of a longer process show the direction in which a continuous improvement initiative is headed. In our tech company example, if the use of the process vocabulary declined, then the company could take corrective action, be it further training or reinforcement of the new process with team leaders.
Alternatively, if the use of the new vocabulary increased over time, then change agents could reasonably predict that the new process was becoming embedded in the organization. No corrective action is required.
Further, when dev teams learned that the company was measuring them on their use of the new process vocabulary, it promoted rapid adoption. The long-term result the company achieved was greater process consistency and more reliable results from its dev teams.
Predicting the Rate of Continuous Improvement
In addition to taking repeated measures of the behaviors that drive change, your team can even predict the rate of adoption of a process improvement initiative. You can do this by plotting a target curve that will predict when you are at least half-way to producing the change you want to create. This is called the "half-life" of the improvement.
Why measure the half-life of the improvement? Because most of the hard work of creating improvements is in the earlier part of the process.
That's when you're training teams and when there is the most energy around your improvement initiative. Improvements tend to level off and approach (but perhaps never reach) 100% after you've reached the halfway mark in the improvement process. Also, you can gauge your progress at the halfway mark and correct your course if necessary.
Once you've created a target curve for improvement, collect your Predictive Metrics over time, and compare your actual rate of improvement to this target curve.
Confused? Here's how it works.
Practical Approach to Analyzing the Rate of Improvement Initiatives
Empirical research on more than one hundred projects produced the expected rate of adoption (in months) for change management initiatives with a low, medium, or a high degree of complexity.
These degrees of complexity are often tied to whether an improvement initiative involves only one function within a company (say HR, Finance, Software Dev), multiple functions (e.g. an initiative to improve product development cycle time that's dependent on a cross-functional team), or multiple entities (e.g. vendor quality). The table below shows the typical half-life for some representative improvement initiatives.
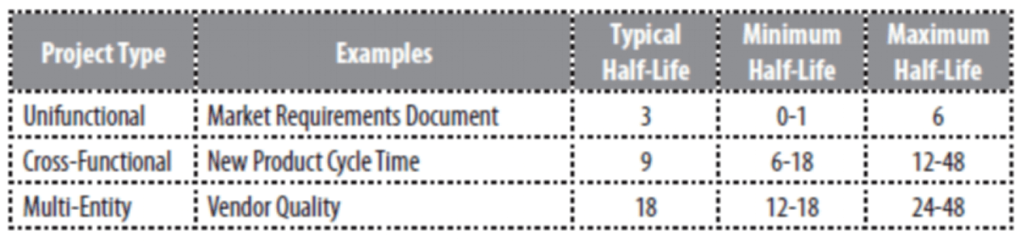 Source: TCGen Inc.
For example, a company wanted each of its dev teams to have a Market Requirements Document (MRD), using a standard template. Their goal was to achieve 90% adoption, meaning that nine out of ten teams would have MRDs attached to their development projects.
Since this improvement applied to dev teams alone, the research told them to expect to achieve their goal in about three months. The team plotted a curve targeting three months as the expected time period to produce 90% adoption of the MRDs. The curve showed that they should be about half-way there (around 45-50%) within a month.
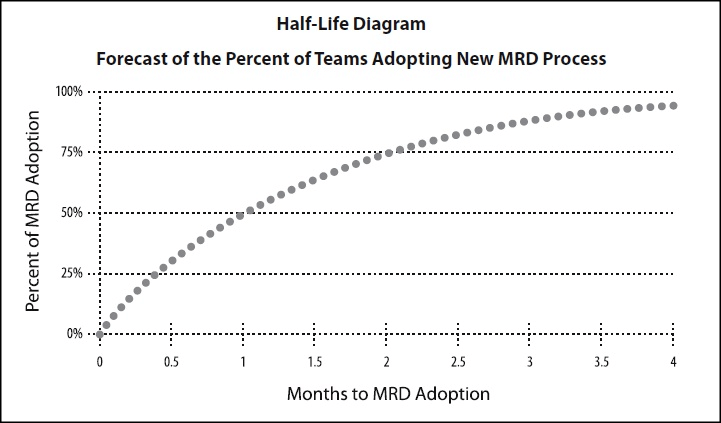 Source: TCGen Inc.
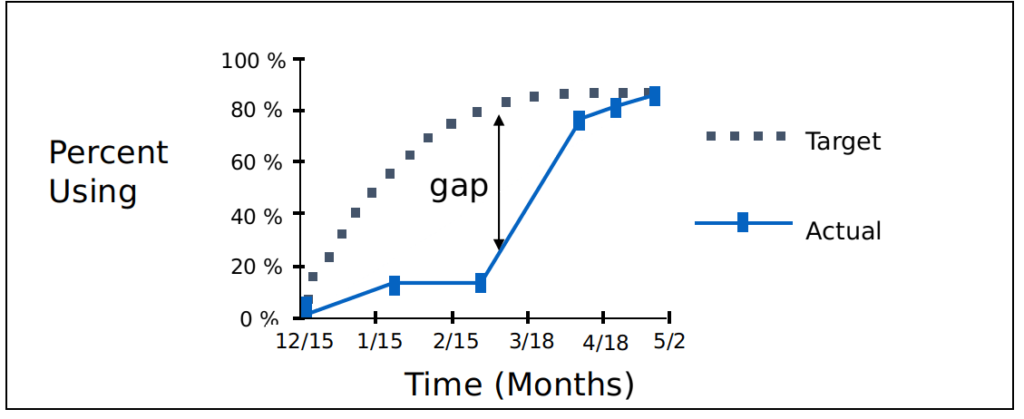
The team then collected the real data ("How many product plans had MRDs attached?") and plotted it against this curve. This gave them a rough estimate of where they stood according to the estimated rate of adoption.
 Source: TCGen Inc.
Predictive Metrics for Kanban
Predictive Metrics apply to the Kanban method in two ways.
A company may use them to influence 1) the adoption of Kanban and 2) to measure compliance after most teams are using Kanban.
Suppose your company is just beginning to introduce Kanban. How do you know your Kanban implementation is taking root? What continuous improvement KPIs could indicate that you're making progress toward implementing kanban boards across your teams?
One simple Predictive Metric for Kanban adoption is the number of teams trained in the method over time. If you're training cross-functional teams, you can expect (per the table above), that a typical half-life for this improvement will be about 9 months, with a maximum of as much as 48 months to implement. Measuring teams trained over time is probably not relevant for a small company with only a few teams, but in larger implementations, it's a simple but key metric.
If you're training a large number of teams on Kanban, set a goal for when you want 90% of the teams trained, and create a target curve employing the Half-Life example above. Plot the number of teams trained over time against this target curve to track your progress.
A more salient measure of Kanban adoption might be the number of tasks entered on the kanban board per team. If teams are entering tasks on the boards, then they've started to adopt the new process.
Measuring Kanban Adoption
After you've achieved your goals for adopting the Kanban method, you can also track continuous improvement metrics. Often, change initiatives take hold for a time, but enthusiasm wanes, and people return to their old habits. How can you measure the behaviors that indicate that the new process has seeded itself in the culture?
One metric for this behavior is how many tasks per team go into the "To Do/Requested" portion of the kanban board. If the number of tasks remains steady or increases over time, then your change initiative has taken hold. If you see a decline in the number of tasks, then examine why this is the case. There might be good reasons, or it might indicate that your teams are returning to old work habits.
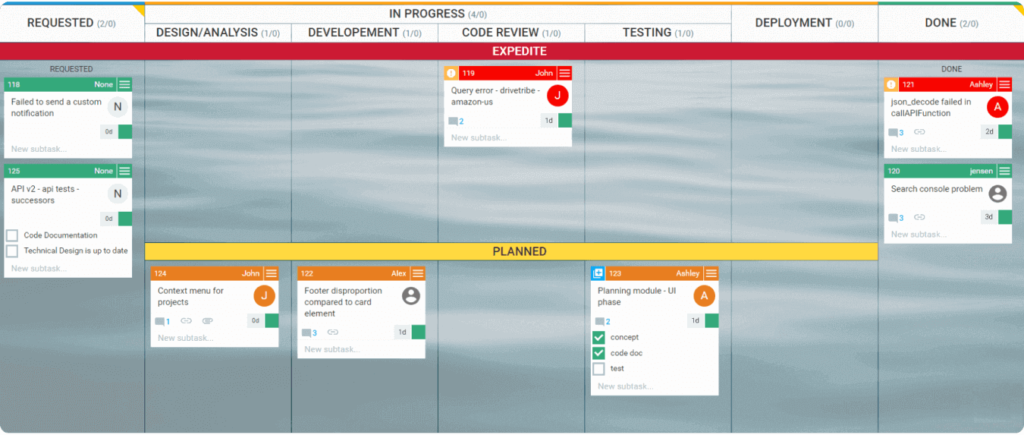
Also, measure how many tasks go from the "to do" into the "working" portion of the kanban board per team over time. This will predict throughput, the rate at which tasks are moving across the kanban boards.
Implementing Predictive Metrics to Drive Change
Predictive metrics are about measuring the choices people in your company make every day. These behaviors drive continuous improvement. Of course, you'll continue to track performance metrics, including KPIs like revenue growth and other basic business measures.
But if you want to drive continuous improvement, your company needs to find the behavioral levers that drive change. Moreover, you need to adopt the habit of running regular experiments in order to check your progress so you can adapt whenever necessary.
Here are some steps to implement Predictive Metrics for your teams:
- Imagine the result you want to create.
- Think about the key levers (a small number, say 3-5) that will drive this change. Ask how you will know that the change is taking root. Then ask, what would indicate that it is not taking root.
- Ask what behaviors will drive these levers: think of what people are doing/will do to make the improvements you want to create.
- Create a key metric for these behaviors, a quantitative measure that will indicate that the behavior you want to inculcate is taking root; these should be few in number (3-5 metrics).
- Create a target curve that represents where you expect to be with respect to your improvement initiative within a period of time.
- Measure the behaviors that drive change: These will predict that you're achieving your goals; plot them against your target curve.
- Now imagine the next result you want to create.
Some of the most powerful distinctions are simple.
The simple but key distinction here is between performance metrics, which indicate where your company has been, and Predictive metrics, which indicate where your company is going. You need both. Many companies have solid KPIs in the first category but neglect the second.
You've already seized the opportunity to improve your project management capability by using Kanban. Now combine the power of Kanban with the capability of Predictive Metrics. Imagine the possibilities for continuous improvement. The horizon is yours to define.

John Carter
Guest Author
John Carter is the Founder of TCGen Inc. and a widely respected expert on product development. He is a co-inventor of Bose's Noise Cancelling Headphones and designer of Apple's New Product Process. He has consulted for Abbott, Amazon, Apple, Cisco, HP, IBM, Mozilla, Roche, and 3M. He is the author of Innovate Products Faster, featuring more than 40 tools for accelerating product development speed.