A Few Words about the Kanban Structure
The Kanban system was invented by TOYOTA in the middle of the 20th century as a visual method to schedule work and maintain inventory. It is one of the key tools that helped the company to become the world’s leading automobile manufacturer, beating competitors like General Motors and Volkswagen. About 10 years ago, David J. Anderson experimented with applying Kanban with the IT department he was managing at the time. A couple of years later he shared the results in his book “Kanban”, which was the beginning of a whole new movement – Kanban for knowledge work.
A typical Kanban system would require a Kanban board (think of it as a whiteboard on the wall) and Kanban cards that you put on that board (think of these as sticky notes on that board). A Kanban board can be represented as a table with at least three columns – “To Do”, “Doing”, “Done”. A real Kanban board would have many columns or horizontal lanes, but let’s stick to the basics for the moment.
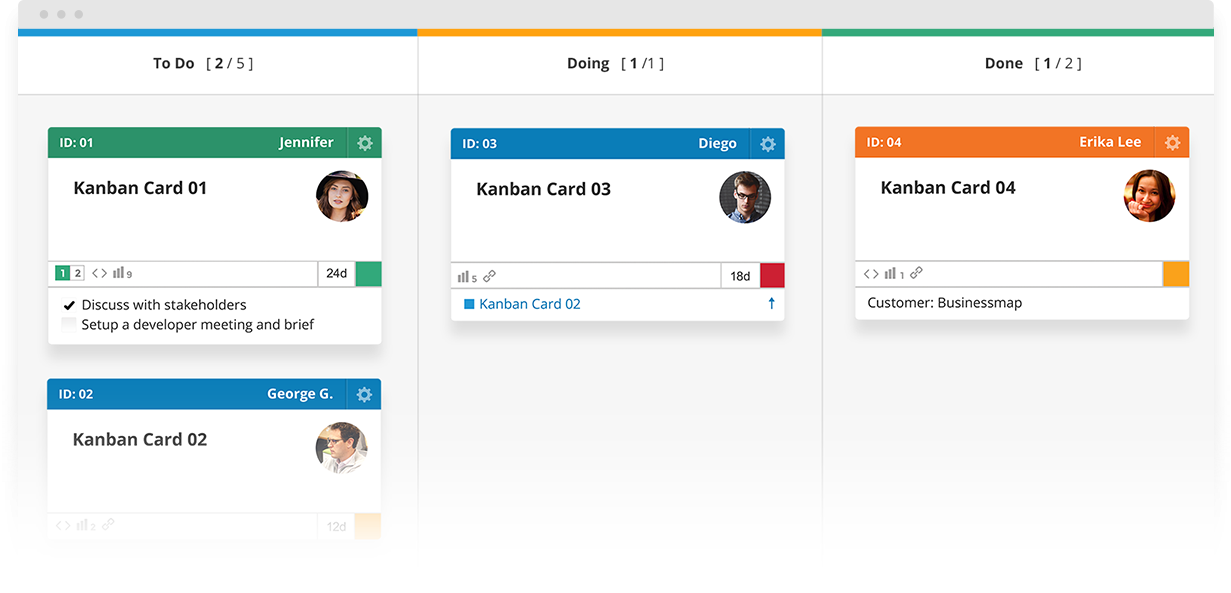
Each column on the board contains Kanban cards that represent a work item, which might be a task to compile a report, develop a program module, set up a meeting, etc. Once a person starts working on a card, the card is moved to DOING and when complete, the card is moved to DONE. The movement of cards is only possible when the column has a free limit capacity, i.e. if the limit is 2 and there are 2 cards in that column, the cards on the left have to wait until at least one of those two cards is moved to the right.
Since the focus of this article is on visual breakdown structure with Kanban and not Kanban itself, we will pause the theory here, but if you are interested in knowing more, you can find more info about Kanban here.
How Is Kanban Compatible with Traditional PM Concepts like WBS?
One of the best things about Kanban is that it is a method that can be applied to any process – you don’t have to change the way you work, the roles in the organization, or even the tools (at least initially). Whatever it is that you do, applying the rules coming from Kanban will boost your efficiency and will make your teams much more productive. There are documented improvements of up to 700% in delivery rates, achieved by just visualizing the work and implementing strict WIP limits.
That said, you can apply Kanban on a traditional waterfall project that heavily relies on a detailed work breakdown structure. In fact, the thesis that we defend in this article is that Kanban is a good fit for implementing the work breakdown structure itself.
Realizing WBS in a Kanban System
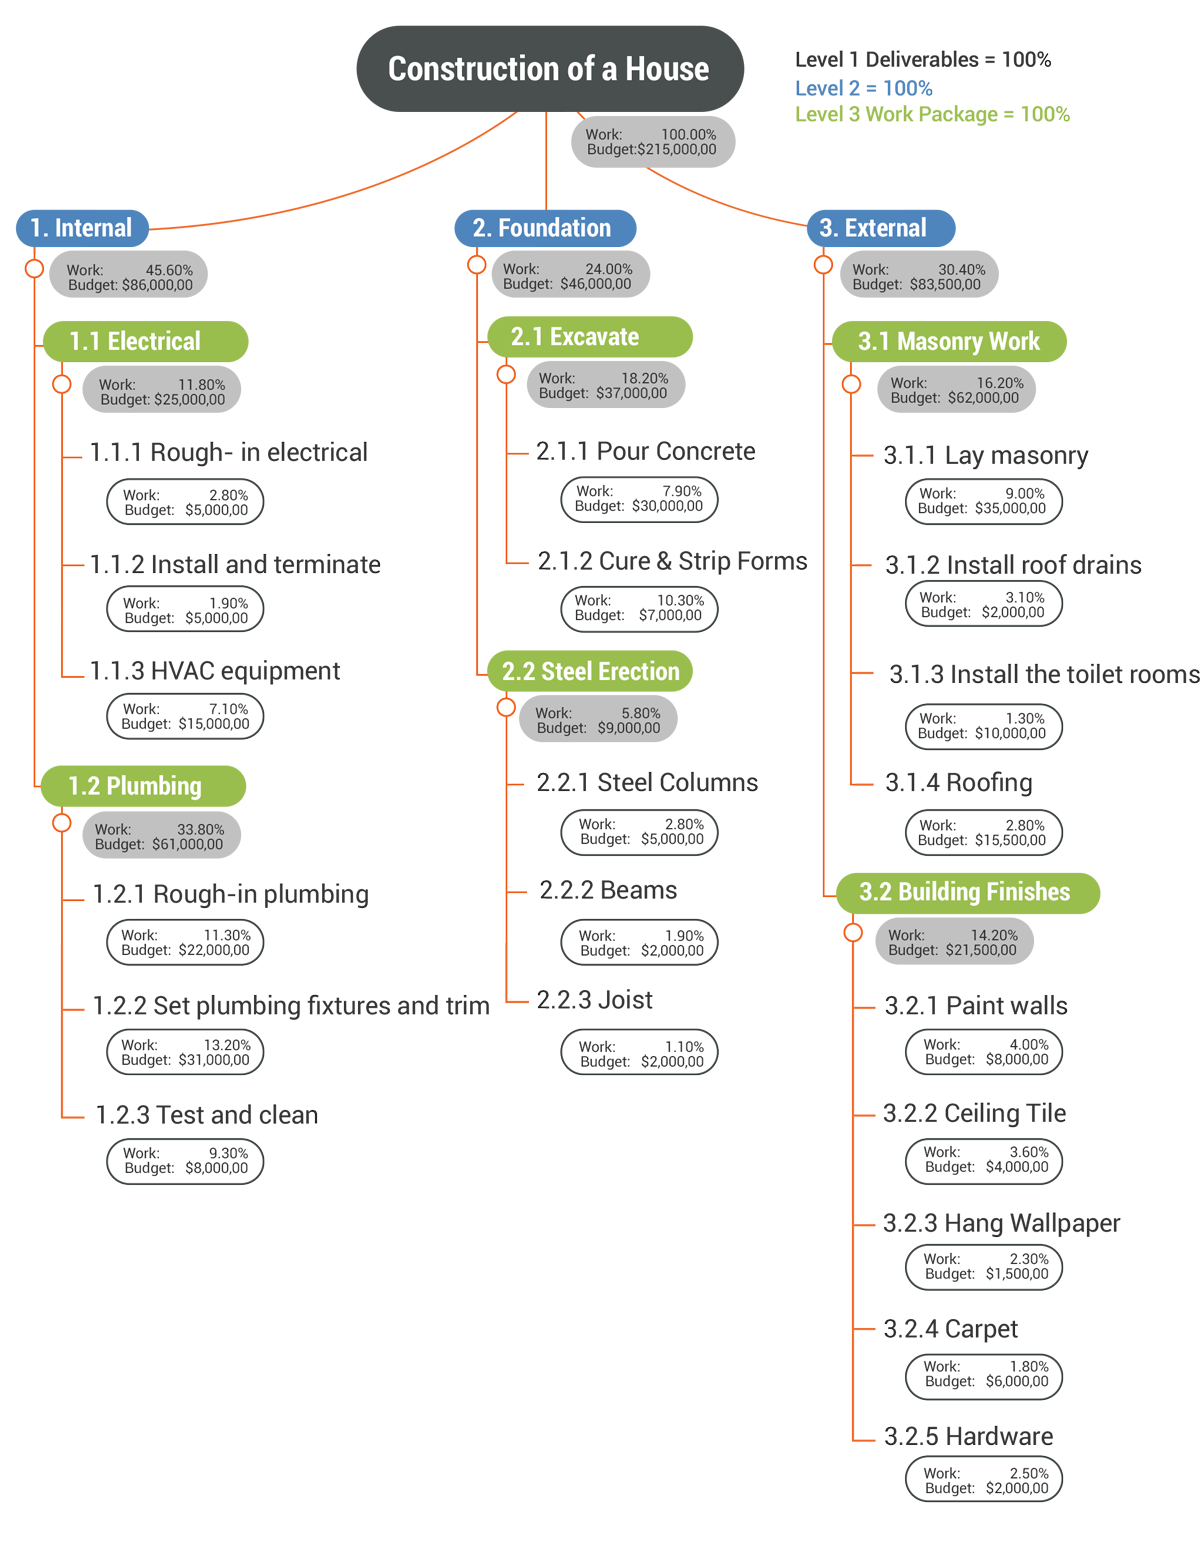
The Project Management Body of Knowledge (PMBOK) defines the work breakdown structure as a “deliverable-oriented hierarchical decomposition of the work to be executed by the project team.”
Let us explore how the typical work breakdown structure can be represented with the help of Kanban boards and Kanban cards. For the sake of illustrating the concepts better, we will use screenshots from the Kanban software solution that we develop.
The first step in the process would be to we create a master “portfolio” Kanban board that represents the LEVEL 1 deliverable. It is the Kanban board that contains all level 2 deliverables and shows their current status (the position of each item shows % complete).
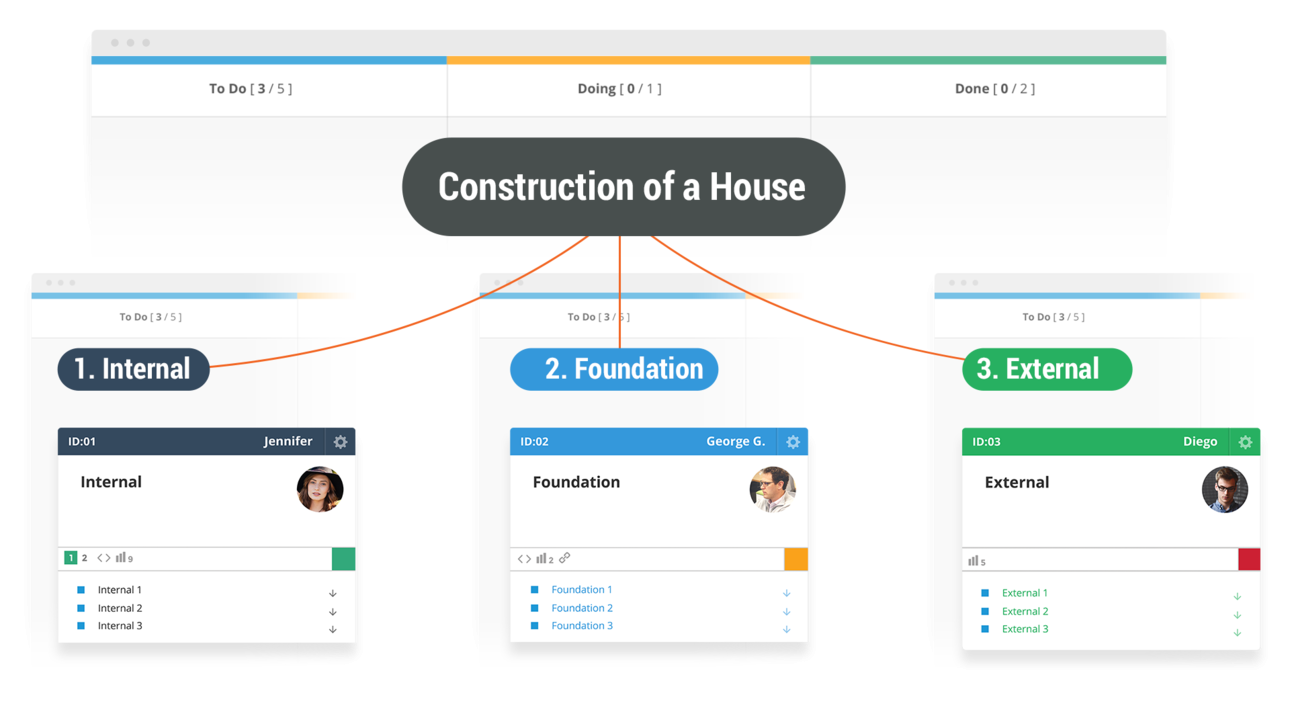
With the second level deliverables available, we can start adding the level 3 deliverables as nested work items. Nested work in a software tool like Businessmap (formerly Kanbanize) is presented via parent and child links between the Kanban cards representing the WBS deliverables. The interesting and KEY part is that we create the different levels in different Kanban boards and by that allow teams to work on the level they are expected to, without dabbling with the bigger picture. So, in reality, a WBS realized with a set of hierarchical Kanban boards would look like this:
Benefits of the Visual WBS Approach with Kanban
Seamless Monitoring and Tracking
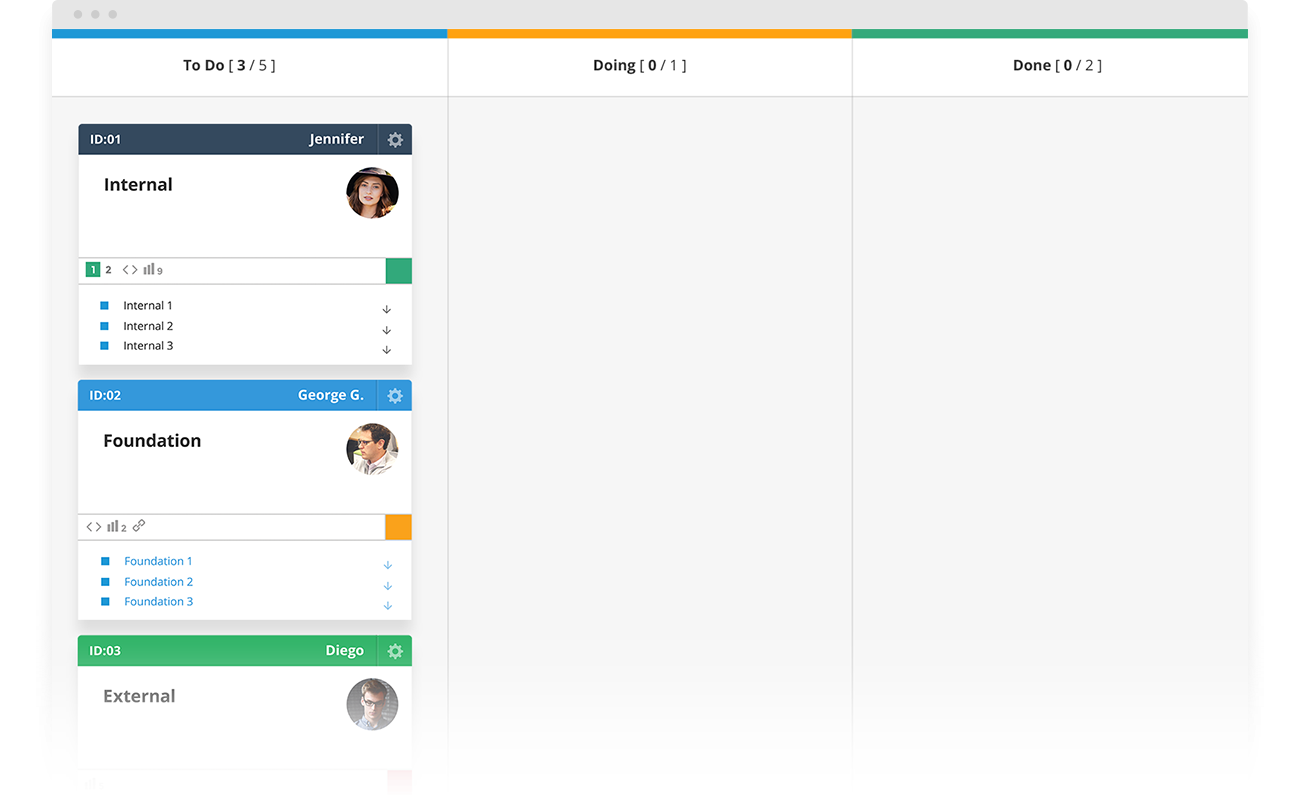
When you’ve got all the information about a project’s progress available at a glance, it is very easy to see where things stand. Imagine the example below:

It is more than clear that the Internal and Foundation deliverables are already completed and the only one still being worked on is the External part of the work breakdown. There’s no need for any report, just a quick glance at the Kanban board and that’s all. Now imagine this view:

Not only it is very easy to see that the “External” deliverable is in progress, but, by the color of the sub-deliverables, you can also tell whether they’ve been completed, whether they are still in progress or not started. The grey color stands for “not started”, the orange color for “in progress” and the green means “done”.
Easy Prioritization
A frequent issue when working on a large project is that priorities get mixed up and people don’t always know what item to tackle first. If all work items are fed into a Kanban system or Kanban software, it is easy to prioritize items by putting the most important ones at the top and pushing lower priority items to the bottom.

If you want to reprioritize some of the work items, just move the item to the top of the queue. This would also give a visual signal to everyone involved in the process that the corresponding item is now more important, which improves the communication flow throughout the organization.
Transparency
Ideally, a Kanban board would be visible not just internally, but also to external stakeholders (customers, senior management, etc.). When you have the status of all deliverables on a Kanban board, it is irrelevant to report on the status, as everyone can look at the board and just see for themselves. This removes the potential for human error from the equation, making the status consistently accurate. In organizations that follow the Kanban principles, all Kanban boards serve as visual information radiators, usually displayed on large LCD displays. Here is what we ourselves at Businessmap do – not only do we use the big 65’’ screen as an information radiator, but we also use it to run the daily standup meetings for all teams.

Another artifact that is specific to Businessmap is the visual representation of the work breakdown structure. When you have implemented the parent/child relationships, you can check the visual representation of the dependencies in the analytics section of each Kanban board. With this color-coded distribution, you can instantly see the items in progress (orange), what has been completed (green) and what is still pending (blue).

One System for Project Managers and Team
In many cases, the only person looking at the work breakdown structure would be the project manager of the project and the team members would hardly know that it exists. This creates a disconnect between the project manager and the team, which is sometimes a root cause for conflict regarding priorities and unidentified dependencies. The option to build and manage WBS via a Kanban software system ensures a productive environment where the project manager can create the work breakdown structure, prioritize and hand over the work to the team within the very same tool. All the value-added from visualization and metrics collected out of the box comes at no additional cost.
Process Automation
An item specific to the implementation of WBS with our project portfolio management platform is the automated business rules. Using the business rules module allows you to configure the system so that all parent items are automatically moved to the correct position, based on the position of their children or also blocked/unblocked when their children are blocked/unblocked. The animation below demonstrates these scenarios.
The ideas presented above have been tested numerous times not just by our teams working daily with Businessmap but also by multiple customers of our tool. The instant visibility, easy prioritization, and the ability to automate all processes in an organization is an attractive incentive that outweighs the minimal investment in time and resources to get this approach implemented.

Nikolay Tsonev
Product Marketing | PMI Agile | SAFe Agilist certified
Nick is passionate about product marketing and business development and is a subject matter expert at Businessmap. With expertise in OKRs, strategy execution, Agile, and Kanban, he continues to drive his interest in continuous improvement. Nick is a PMI Agile and SAFe Agilist certified practitioner.