The fishbone diagram, also known as the cause-and-effect diagram, is a causal graphic representation of potential causes of a given problem or defect. The tool is also famous as the Ishikawa diagram by the name of its creator Kaoru Ishikawa. The diagrams are used to identify causal factors as sources of variation. By grouping those factors, Ishikawa diagrams allow classifying multiple sources of variation into categories and help to narrow down a problem’s root cause. The technique is widely applied to prevent quality defects.
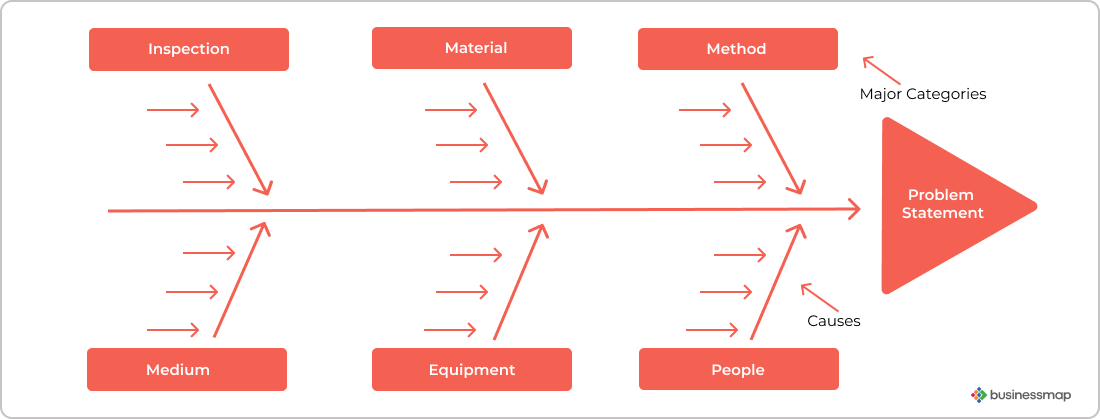
The diagram itself takes the shape of a fishbone where the defect is represented as the head of the fish and the bones represent the major identified root causes. Sub-causes are shown as the ribs of the fish.
The quality control tool is ideal to visually represent the output from brainstorming sessions where root causes are identified by analysis teams. All root causes and their causal factors are easily represented and available at a glance. A potential drawback of fishbone diagrams is that the visualization of complex problems with multiple causes and sub-causes makes it hard to interpret the relationship between them.
What Is the Purpose of Using a Fishbone Diagram?
Employing fishbone diagrams aims to help identify defects’ causal factors and prevent their further occurrence. The diagrams help teams visualize their ideas of potential defects’ root causes and causal factors. The graphical technique is especially helpful to troubleshoot quality-related issues and it is considered one of the seven basic quality control tools. Some of the areas where fishbone diagrams are widely used include product development, manufacturing, customer service, document management, healthcare, troubleshooting, etc. The visualization technique can be effective for overall process improvement.
Where to Use a Fishbone Diagram?
Fishbone diagrams are easily drawn and can be adopted by multiple teams and industries to facilitate the identification of defects’ root causes and effects. Some of their practical applications are listed below.
-
Fishbone diagram in manufacturing. The technique’s application in manufacturing helps in causal analysis of a problem. It is extremely helpful as a brainstorming tool when there’s not enough data to support problem-solving efforts.
-
Fishbone diagram in healthcare. Fishbone diagrams are applicable in the medical field for the identification of various inefficiencies such as delays in diagnosis or diagnostic errors.
-
Fishbone diagram in labs. Cause-and-effect diagrams are used to determine the root cause of laboratory issues such as incorrect test results or inefficient laboratory data management.
Can Fishbone be Used in Problem Solving?
Yes, through the identification of major causes, contributing factors, and their analysis, the Ishikawa diagrams support problem-solving. The tool is adopted in the analysis phase of the Six Sigma approach to problem resolution and it is one of the techniques for root cause analysis. By answering questions related to the root cause of an event or the factors causing the most variability in a system, the diagrams help to narrow down teams’ problem-solving efforts.
What Are the Advantages of the Fishbone Diagram?
Fishbone diagrams bring benefits to process improvement as well as problem-solving thanks to their visual comprehensiveness. Here are a few of the underlined advantages the tool has to offer.
- Fishbone diagram helps to visually represent a problem statement, its major causes and supporting sub-causes.
- The diagram supports brainstorming ideas by visually representing them in a single hub.
- The graphical tool offers a view into the state of a problem available to team members and stakeholders alike.
What Are the Limitations of the Fishbone Diagram?
Unfortunately, some of the fishbone diagram’s most obvious advantages can turn into challenges if not used correctly. Some of Ishikawa diagram’s limitations are listed below.
- Devising complex issues with multiple causes and sub-causes can lead to an overcrowded and cumbersome diagram.
- Brainstorming sessions can sometimes bring multiple irrelevant potential causes and factors that may turn into a waste of time.
- Relationships between multiple causes and factors can sometimes be difficult to identify.
What Are the 6Ms in the Fishbone Diagram Used in Manufacturing?
At the heart of the Lean production method lies the elimination of waste and the aim to reduce turnaround times. Originating from the Toyota Production System, Lean manufacturing puts an emphasis on continuous improvement while eliminating wasteful activities from the process. Thanks to its comprehensiveness and visual appeal, the Fishbone diagram is widely used to identify quality-related issues and as a means to achieve continuous process improvement.
To navigate the process of defects’ identification, the Ishikawa diagram technique employs one of the widely used frameworks to root cause analysis - 6Ms. The method helps to determine the sources of variations in a process and to reach a problem’s root cause. The components of the 6Ms framework in manufacturing are listed below.
- Manpower: Refers to the physical or mind/knowledge work of personnel.
- Method: Refers to the production process.
- Machine: Refers to all the equipment, tools, and facilities used for the production.
- Material: Refers to the raw materials used for the production of a final product.
- Medium (Environment): Refers to the effect of unpredictable environmental factors such as weather, floods, humidity, etc.
- Measurement: Refers to inspections and physical measurements such as volume or temperature, etc.
How to Create a Fishbone Diagram?
Creating a fishbone diagram offers possibilities to uncover a problem’s root cause, hidden relationships between causes and effects, as well as process bottlenecks and areas for improvement. The steps to creating a fishbone diagram are explained below.
-
Determine a problem statement: The responsible team members and stakeholders should identify and agree on a statement that describes the problem. The statement is drawn at the head of the diagram (fishbone skeleton). A horizontal arrow pointing to the head is drawn across the page (the fish backbone).
-
Brainstorm major causes: Problem’s causes are grouped into categories such as manpower, method, machine, material, medium, measurement (using the 6Ms framework to root cause analysis) to facilitate the brainstorming session. The categories are drawn as the fish’s bones with arrows pointing to its backbone.
-
Brainstorm all possible causes: Using methods to root cause analysis such as 5Whys, the analysis team should find contributing causes to each major cause category. These are represented as branches of the fish’s bones on the diagram. The layered bones which are produced as a result of identifying sub-causes show the causal relationships.
-
Analyze the diagram: The team analyses all major and contributing causes by asking why-questions. In case the root cause of the stated problem is still not identified, the focus shifts to areas of the diagram with fewer ideas and the brainstorming continues.
What Tools do You Need to Create a Fishbone Diagram?
Creating fishbone diagrams is possible through a wide variety of tools on the market - you can use Excel, Word, PowerPoint, or more advanced graphic design software. You can start, however, with a simple whiteboard and post-it notes for your categories of causes.
Is there any Fishbone Diagram Creator?
Yes, you can use a wide range of online software solutions to create a cause-and-effect diagram to root cause analysis. Among the most prominent fishbone diagram creators are Canva, Figma, Edraw Max, XMind, Miro, and others.
What Is a Fishbone Diagram Template?
An easy way to begin the root cause analysis is with a fishbone diagram template. It includes graphical elements where problem statements, major cause categories, and sub-causes should be indicated. The diagram also uses arrows as a means to show the cause and effect between different elements including their relationship to the problematic event. The fishbone diagram template is easily customizable and can be used as a problem-solving technique in any context and industry.

What Are the Examples of Fishbone Diagram?
An example of a fishbone diagram application is its use for investigating accidents at the workplace. The brainstorming of potential causes from various team members’ perspectives is an essential asset for the analysis of the situation. The approach allows the uncovering of the true cause of the accident but also encourages improvement efforts and navigates the corrective action plan.
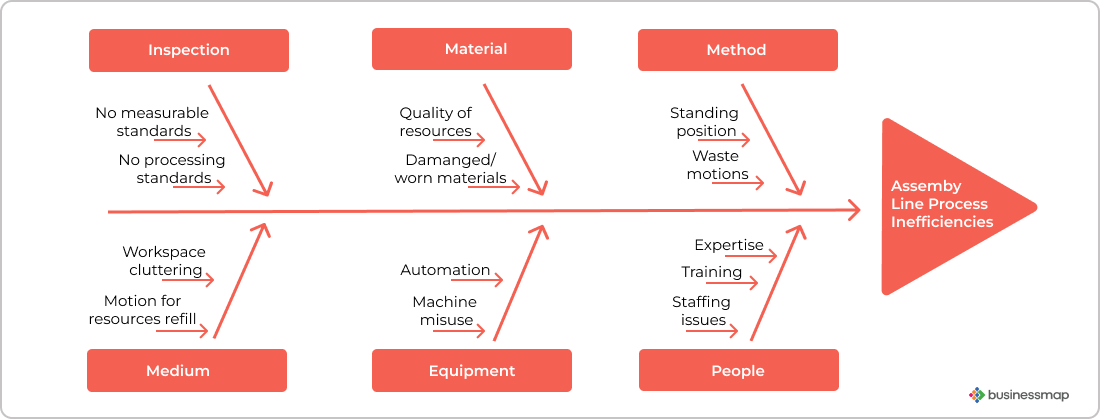
Manufacturing also uses the Ishikawa diagram to investigate problematic events. In the example diagram below, an assembly line production process is found to be inefficient. The analysis team has agreed upon the problematic statement, the major involved categories of causes have been also determined using the 6Ms framework and potential causes have been identified through brainstorming. All the elements have been mapped at the designated place on the diagram.
What Is the History of the Fishbone Diagram?
Fishbone diagrams were first used for identifying cause-and-effect relationships in the 1920s. Along with the check sheet, control chart, histogram, Pareto chart, scatter diagram and stratification, they are considered one of the seven basic quality control tools. Thanks to Mr. Kaoru Ishikawa, the diagram became popular in the 1960s as a tool in the quality management processes at Kawasaki shipyards.
What Is the Relationship Between Root Cause Analysis and Fishbone Diagram?
Fishbone diagrams are part of the toolset for root cause analysis. Causal graphs are used to map key events or causes of specific problems or defects. Thanks to its visualization nature, the fishbone diagram makes it easier to understand the relationships between a variety of causes. The tool can be used in reactive management to identify and address problems quickly, as well as in preventative management since it draws attention to additional causal factors.
How Do You Use a Fishbone Diagram and 5 Whys Together?
The 5 Whys technique is among the most effective methods for identifying the root causes of a problem. It can also be applied to a wide range of problems. To identify the root cause of a defect, the analysis team asks why-questions while brainstorming causes and sub-causes. Fishbone diagrams and 5 Whys can be used individually or together as both can help identify the core of an issue as well as its effect. Allowing to understand the cause and effect relationship, the tools help to quickly identify and react to root causes and additional factors. This improves teams’ work efficiency and nurtures strive for improvement.
What Are the Similarities and Differences Between 5 Whys and Fishbone Diagram?
Originating from the Lean philosophy, both techniques support the process of problem’s root cause and effect identification. The methods can complement each other by helping detect the major causes of a defect as well as identifying the cause and effect relationships between a variety of factors. While the 5 Whys technique helps during brainstorming sessions to narrow down the underlined fault’s cause by asking repeatedly the question “why this happen?”, the fishbone graph offers organization of all causes as well as visualization of their connection to one another.
What Are the Other Tools to Increase Work Efficiency Similar to Fishbone Diagram?
The Lean philosophy made the appearance of a range of tools that support not only problem-solving and decision-making but also workflow efficiency and process improvement. Some of the techniques such as Fishbone diagrams which directly impact workflow efficiency are listed below.
We offer the most flexible software platform
for outcome-driven enterprise agility.