It’s crucial to start with understanding the principles of Lean Six Sigma to make the best of the process improvement model. Another key prerequisite to its successful implementation is using the right techniques that suit your unique business needs. Lean Six Sigma offers various tools that will help you improve quality while eliminating wasteful activities and variations so you can boost your process efficiency.
The Most Popular Lean Six Sigma Tools
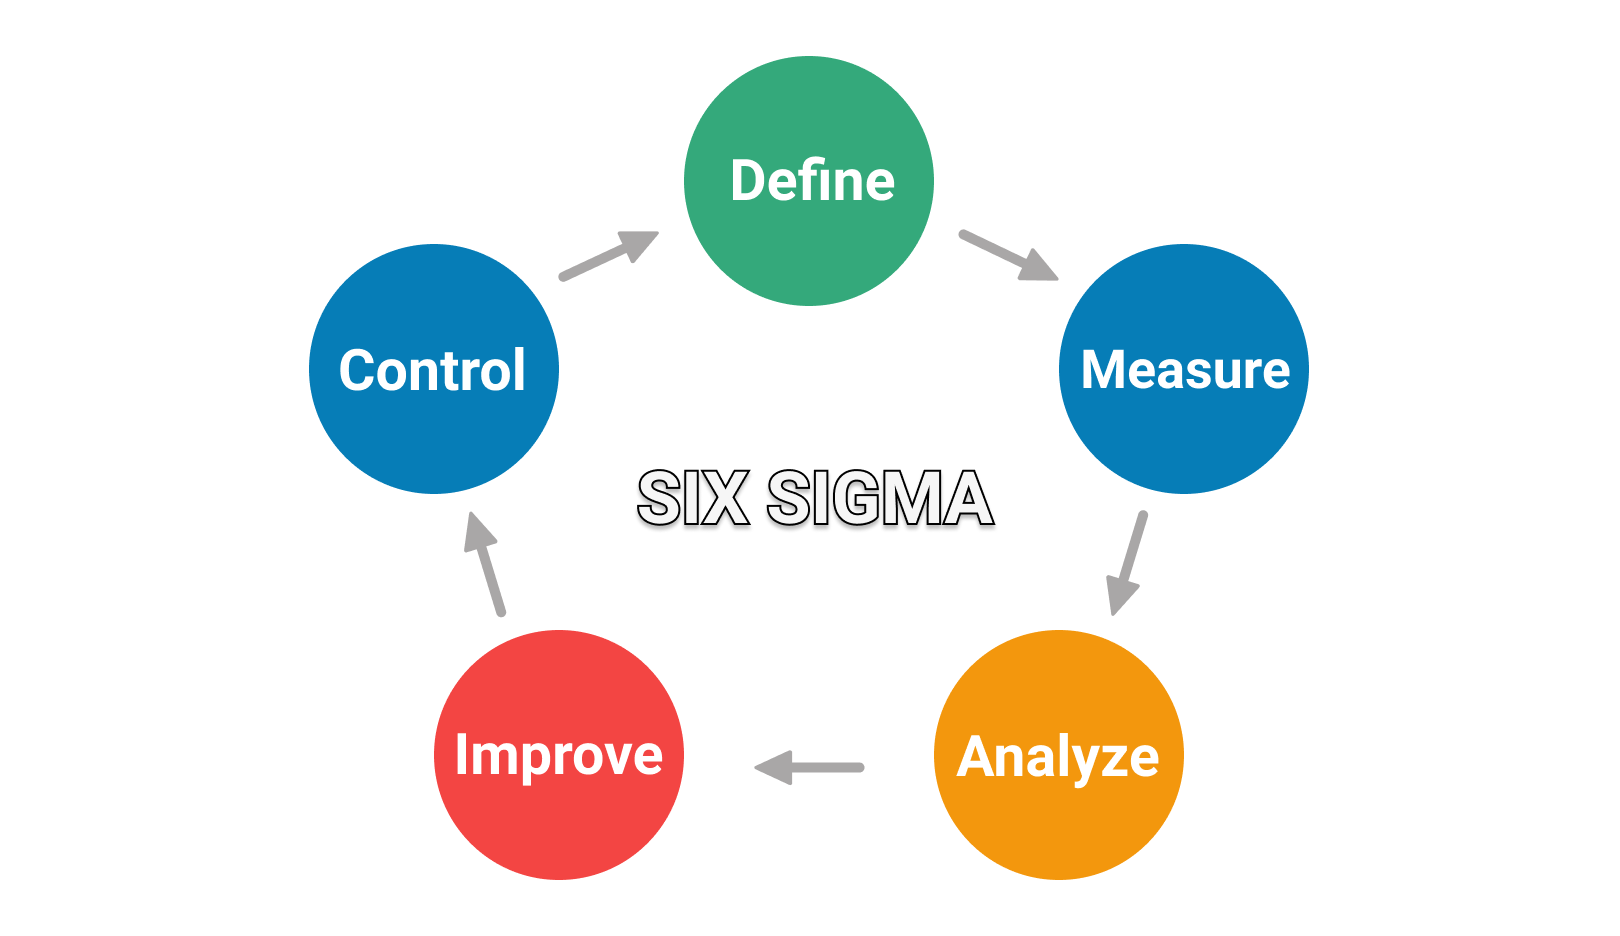
The Lean Six Sigma approach employs the DMAIC (define, measure, analyze, improve, control) process improvement cycle. For each stage of the process, you can use a variety of LSS tools and techniques. Define Phase
The following techniques are widely applied during the Define stage of the DMAIC cycle. Using them can help you identify all the aspects of a problem - the scope, the customer expectations, and the stakeholders’ perspective.
- Voice of the Customer (VOC)
The focus of the Six Sigma technique is capturing the customers’ requirements and viewpoints. The data is collected through focus groups, in-person interviews, surveys, etc. Once presented in a measurable way, it can provide key insights into your next steps towards improving or resolving the defined problem.
This Lean practice allows you to analyze and optimize your delivery process. VSM helps you visualize all process steps that a product or service goes through - from the beginning of the production cycle until it reaches the customer (internal or external). This way, you can identify wasteful activities in your process and spot other problematic stages that you can optimize.
Measure Phase
There’s a variety of statistical tools, charts, and graphs that can help you get a visual representation of your performance in measurable data. With their help, you can set a “baseline” for your expected performance which is essential to the Measurement phase of the DMAIC process.
The analysis tool shows the occurrence frequency of specific causes of а problem. Through visualization of the collected data and grouping those causes into categories, the chart provides insights into areas for improvement. The technique is ideal for breaking down more complex problems into their components and draw attention to the most significant ones.
The technique helps inspect the current capabilities of your existing process and to determine whether it meets customer requirements. One way to determine your process capability is via the throughput metric. A helpful tool to display it visually is the throughput histogram.
It allows you to gather large amounts of data and draw conclusions about variations in your delivery rate. As a result, you can understand whether that variation is caused by common or special causes so you can take the right measures to stabilize your process and ensure it performs in a way that meets your customers’ expectations.
Analyze Phase
The Lean techniques below can help you identify and analyze the root cause of the problem by defining its scope and source.
The 5 Whys root cause analysis focuses solely on finding what’s causing the problem. By progressively asking the "why" question (most commonly 5 times), you can analyze what triggered the problem in the first place and think about how you can prevent its reappearance in the future.
The analysis technique aims to highlight the weaknesses of an ongoing process, design, or service. The model works best with actual historical data to identify all probable failure modes in the process. This way, you can focus your improvement efforts on the most urgent domains and reduce or eliminate the identified failures with the highest priority.
It represents a statistical approach to determine the relationship between a number of variables. Then, by visualizing how the selected variables relate to one another, you can identify inefficiencies or spot patterns in your process so you can take the necessary improvement actions.
Note that you can use many other problem-solving techniques such as Design of Experiments, Multi-vari charts, or other statistical tools to analyze the variations in your process.
Improve Phase
Once you have identified and analyzed the root cause of the problem, you need to implement and verify the proposed solution. For this purpose, you can use the methods below to support your continuous improvement efforts.
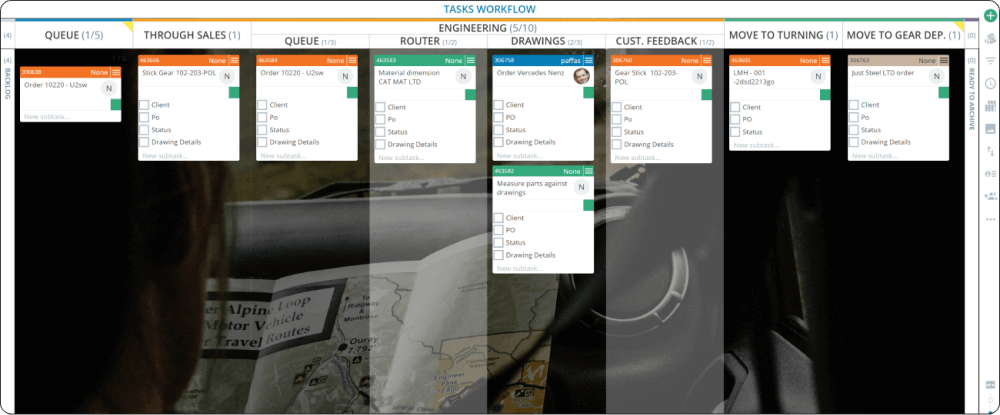
Kanban is a workflow management method that relies on visualizing work, collaboration, and limiting work in progress. It calls for an evolutionary change without disturbing the present state of work, making it easily applicable to organizations. By visualizing your tasks and limiting the work in progress, the method helps you find bottlenecks, reduce context switching, and understand how work flows throughout your system. This helps you progressively become more efficient.
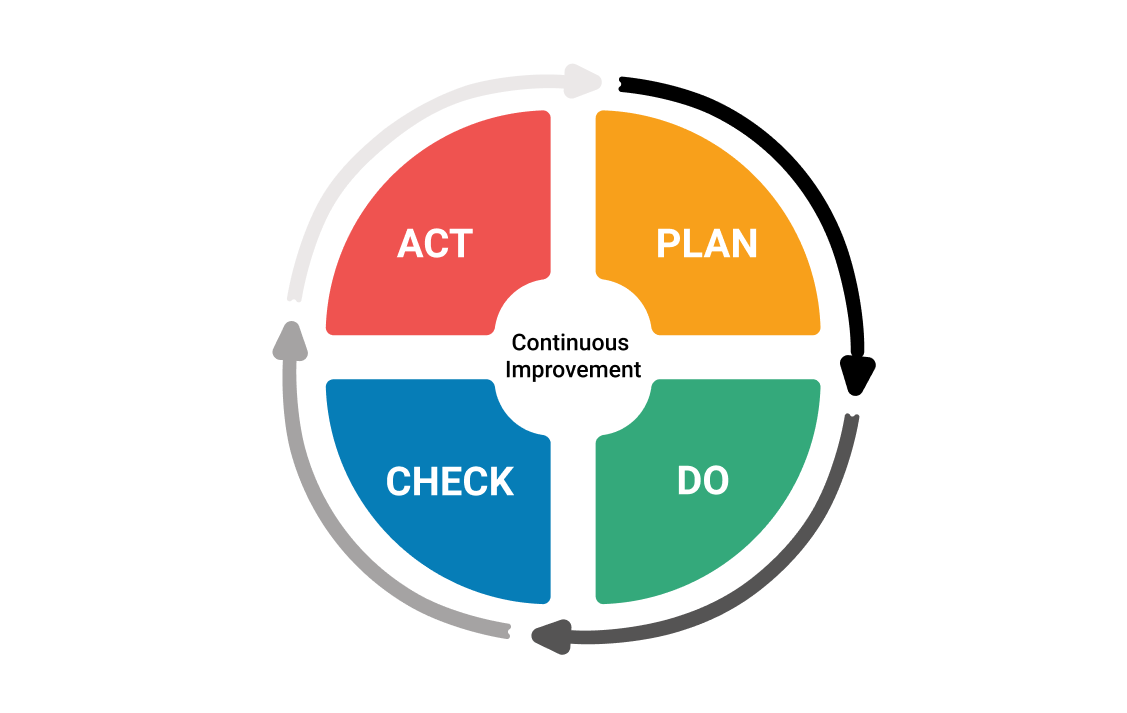
The method navigates you to reach the desired solution by testing it on a small scale in a controlled environment. The model represents a cycle that is based on running experiments, collecting feedback, and taking corrective actions if necessary. As a result, you become more efficient in problem-solving with each cycle. When applied successfully, the PDCA method can positively impact your productivity and drive continuous improvement. In addition, there’s an array of additional tools available to help you improve: Kaizen, Brainstorming, Error-Proofing, Single-Minute Exchange of Die (SMED), and others.
Control Phase
The LSS tools listed below will help you establish control over the improvements and ensure monitoring of your process. In addition, you can expand the improvement further through applying and sharing new knowledge.
The 5S is a method to workspace/workflow optimization including the following five steps:
-
Sort necessary from unnecessary tools, steps in your workflow/workspace.
-
Set to minimize all waste.
-
Shine to utilize the full potential of your tools, equipment, or processes.
-
Standardize your workflow.
-
Sustain the implemented changes to foster continuous improvement.
Once you achieve improvements, you need to concentrate on maintaining control and keeping the improvement trend live. For instance, through diligent documentation of the operational steps, processes, checklists, you’ll facilitate the adoption of further changes/improvements. With standardized work, you aim to clearly communicate how work is done and reduce inefficiencies from the workflow.
This Lean technique aims to eliminate defects by correcting and preventing human and mechanical errors as early in the process as possible. Through work standardization, the method helps prevent the occurrence of mistakes.
- Statistical Process Control (SPC)
The technique allows you to visualize and understand the process in real-time with real performance data. Using control charts to track all improved capabilities allows you to get a clear overview of the performance over time and take corrective actions if your process fails.
The Six Sigma tools and Lean portfolio offer many possibilities. You can explore further the two methodologies and their specific techniques for process analysis, visual analysis, or statistical analysis and choose the ones that would best fit your business needs.
How to Pick the Right LSS Tools?
Consider the following steps when shortlisting the Lean Six Sigma techniques to help your process improvement strategy.
- Understand the tools - what they are best used for and what their purpose is.
- Context is key - choose a tool/s that fits your specific environment.
- Expert guidance - implement Lean Six Sigma and ensure ongoing training of employees.
- Supporting software, charts, graphs, etc., can play a major role in the successful Lean Six Sigma implementation.
We offer the most flexible software platform
for outcome-driven enterprise agility.
In Summary
The Lean Six Sigma approach represents a business metric that delivers measurable results and a way to control and sustain those results. To facilitate the adoption of the approach, Lean and Six Sigma offer a wide portfolio of tools and techniques for performing:
- Process analysis
- Visual analysis
- Statistical analysis


 Define Phase
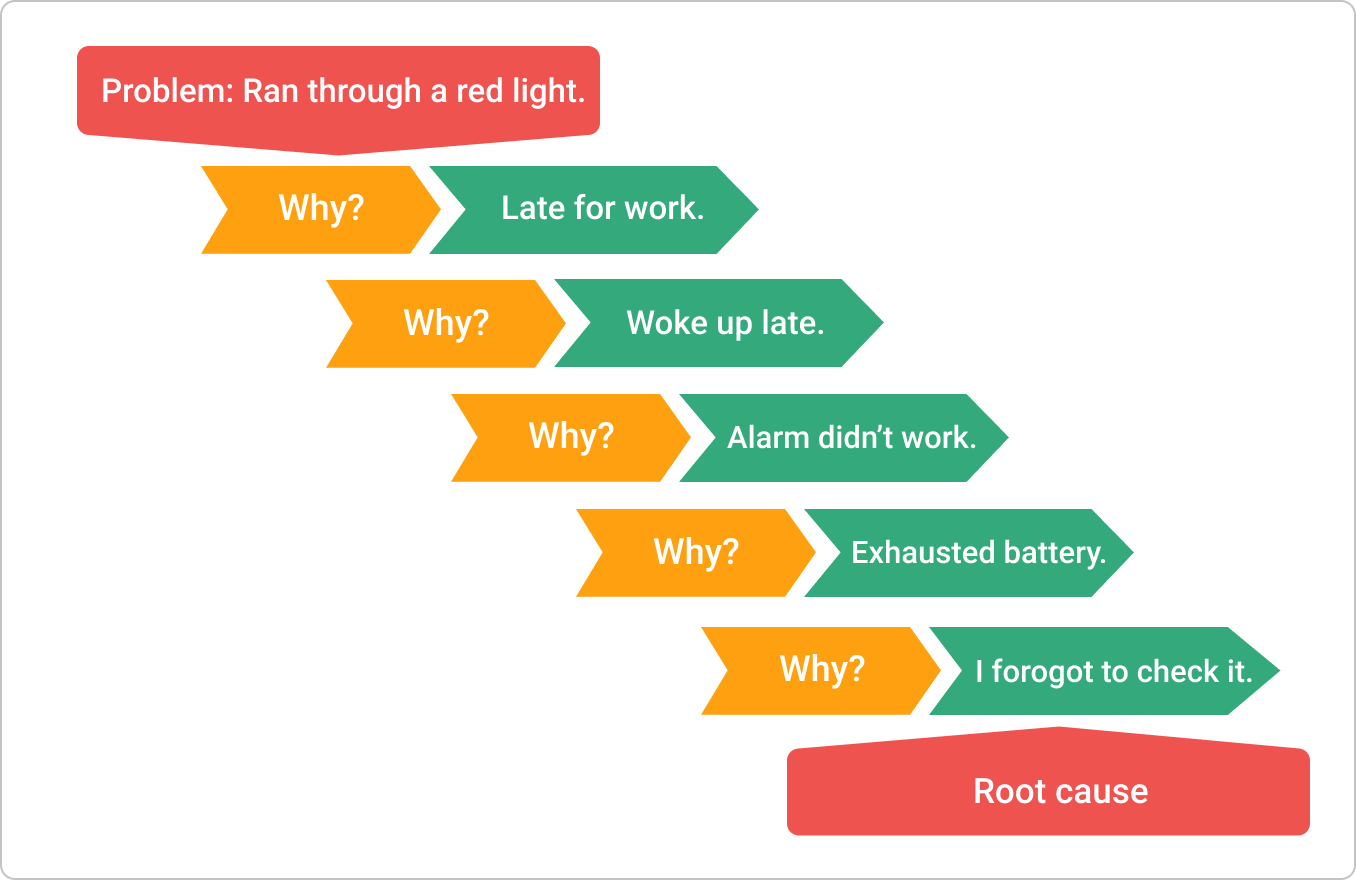
 In addition, there’s an array of additional tools available to help you improve: Kaizen, Brainstorming, Error-Proofing, Single-Minute Exchange of Die (SMED), and others.