“What is the status?”, “When is it going to be done?”, "How many epics/features will we be able to deliver by then?" – these are the most important questions that product and project managers hear all the time. As important as they may be, it is quite hard to get an answer, especially with big projects that are hardly ever “on time”.
When we are pressed to the wall, we revert to the old ways of building plans and forcing people into following them. Our plans fail day after day. We update them, then apply more pressure on the teams. Everyone starts accepting more and more work, trying to accomplish the impossible.
When it’s far too late, we realize we’ve created quite some mess, and we don’t have a clue where things stand. This is when the management usually gets training and starts hearing about Lean, Kanban, Portfolio Kanban, Portfolio Management, etc.
How Is Status Tracked in a Traditional Portfolio Management System?
In the traditional project management approach and even some of the Agile frameworks, a project portfolio's status is tracked with a set of charts and reports, such as burn-down charts, project bubble charts, Gantt charts, etc.
However, they all rely on a fundamentally broken assumption, which renders them invalid most of the time. This is the assumption that we can estimate how much time work items will take in the future.
All of the portfolio management tools and practices out there rely on estimation. Like it or not, estimation is always inaccurate, at least when we talk about knowledge work. The more complex the project is, the less precise the estimation becomes.
When estimation is not accurate and practically speaking, it can never be accurate, then we find ourselves in a dead-end situation. So why are we doing it?
The simple answer to this question is that we try to figure out the scope and timeline first to estimate the project's budget. That is why we need to spend weeks trying to estimate every requirement, which would help us provide deceptive clarity of “when things will get done”.
Then, when the budget and the workload are “known”, we can prepare the schedule and add the project to our portfolio monitoring system. If the work items take less than the time we’ve estimated, things are okay.
If they take more (which is the common case), then we go to yellow and red. That’s when the “we are not on time” happens, and that’s when everyone works on the weekend and tries to achieve the impossible.
We Need to Change Something
You can skip all that. Instead of committing to a fixed scope, time, and budget project, you can commit to a shorter period of time and see how much work you can complete. Then, based on your actual results, you can forecast how much time you’d need for the entire project. When you have this information, you can calculate the cost as well.
It is easier said than done because it requires understanding from both the vendor and the customer, but it is the only reasonable way to plan a project with many unknowns. And by the way, this approach protects both sides. Let’s see how that happens.
Suppose you have a big project that is roughly estimated at around 25 months. You offer the customer to work on the project for five months and consume one-fifth of the budget (this may vary). After five months have passed, you can check the following:
- Have you finished one-fifth of the work or anything close to that (it’s normal to be slower in the beginning)
- Have you actually consumed one-fifth of the budget?
- Are there any new risks that you were not aware of in the beginning?
- Is this project still interesting for the customer? Maybe the market changed?
Now, if you were that good at estimating things, you would be right on track in the beginning. Since this is not going to be the case, you and the customer have options to weigh. For example, you can tell the customer that your initial estimation was completely wrong, and to deliver the project, you need 2x the budget.
10 Years Kanban Experience In 1 Free Book.
Project Manager's Guide to Kanban
The customer either accepts (and gets a working product at the end), or rejects (and saves 4/5 of the budget, which would have been lost otherwise), or proposes changes to the scope. Doesn’t this approach protect both sides? Well, 1/5 of the budget may be lost, but it’s better to waste 1/5 instead of everything.
But how do you know how much time you need? Projecting linearly will get you into trouble, so you better have a more sophisticated mechanism to do it. That’s where the software you use comes into play.
Portfolio Kanban Software and Monte Carlo Forecasting
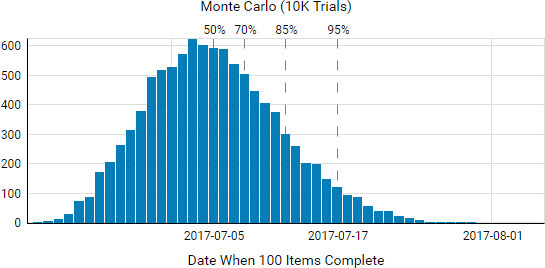
A huge benefit of adopting Portfolio Kanban software is that you can use statistical analysis, such as Monte Carlo simulations, to forecast how much work you can complete in a given time period.
This analysis is based on your historical data, and surprisingly enough, you don’t need loads of it to get started. Of course, the more data you have, the better the forecasting will be, but even 20-30 completed items are more than enough to start with.

One important addition, however, is that you can only forecast with a certain probability. We have to accept that we do not live in a deterministic world, and it’s time that we develop a probabilistic view of how we manage our projects. This means that whenever we say a date, we should attach a probability to this date.
For example, we shouldn’t claim that our project will be finished by the 20th of November. Instead, we should say: “There is an 85% probability that we complete this project by the 20th of November”. It’s a different statement.
We’re coming to the most important part. What are the mechanics of the forecasting process? How does it work? Well, it’s a bit embarrassing to reveal how simple it is, but still:
- You open your Kanban board, and you count how many work items you have in the backlog. This approach works on both a Team and Portfolio level. In the latter case, you just have to open your Master Kanban board where you plan bigger projects or initiatives and then count the work items in the portfolio backlog.
- You go to your analytics engine and enter this number in the Monte Carlo simulation.
- The simulation reveals the projected date with a given probability (85% or 95% is preferred).
It’s hard to believe that it can work, but it actually does. If you want to see it in action, give Kanbanize by Businessmap a try for 14 days for free and see yourself.
We offer the most flexible software platform
for outcome-driven enterprise agility.
In Summary
Forecasting on the Portfolio Level is possible when:
- You negotiate shorter projects or iterations
- You implement a Flow-based approach such as Kanban on the team and portfolio level
- You have some historical data to base your forecasting on