Establishing a stable workflow is the key to building successful and productive teams. A stable workflow helps your organization deliver faster to market and brings greater value to your customers.
But how can you measure the success rate of your workflow and improve it?
The answer is simple - with statistically significant data. Using Kanban metrics is necessary for understanding how your team is performing and where they need to improve. This is why most of the contemporary online Kanban solutions are equipped with powerful analytics modules that provide you with valuable workflow metrics.
With Kanban metrics, you don’t need to guess when project work will be done, as they give you hard data on the productivity, efficiency, and reliability of your production process.
Here is why you can consider these as team productivity metrics and process efficiency reporting.
Now, let’s discover which are the essential Kanban reporting metrics that you need to know.
Lead Time and Cycle Time
Lead time and Cycle time are two of the most important and useful Kanban metrics. They can help you understand how long work items stay in your workflow until they are completed. Lead time is the total amount of time a task spends from order to delivery in your system. Cycle time is the amount of time you spend actively working on it.
People often confuse these two workflow metrics, but there is a clear difference. The lead time starts from the moment a new task is requested and ends when it is done. On the other hand, the cycle time begins when someone actually starts working on a given assignment. In other words, cycle time starts from the commitment point.
Both metrics are essential because they can show you how long it takes for work to flow through your value stream.
You can use lead time data to analyze if work items wait for too long before they enter in progress. On the other hand, cycle time metrics help you understand the amount of time needed for the actual completion of a given task.
How to measure Cycle time and Lead time?
To measure the average cycle and lead time, you can use a Cumulative Flow Diagram - one of the most advanced data sources for your workflow. The CFD can show you the average cycle time and lead time, as well as the number of work in progress items. This way, you can see how stable your workflow is and where you need to improve.
Learn more about CFD
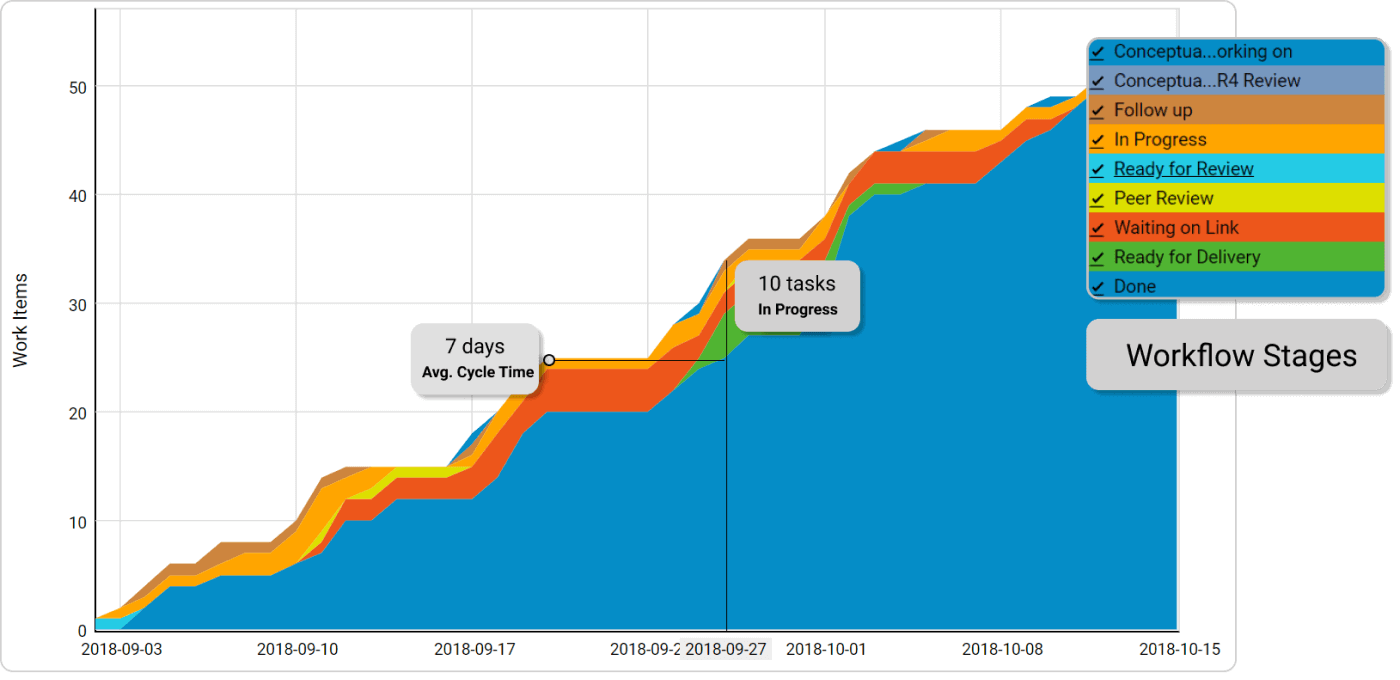
Cumulative flow diagram
If you want to analyze the cycle time of individual work items, you can use the Cycle Time Scatter Plot. It will help you spot tasks that took a greater amount of time to be completed and discover and analyze possible reasons that slow down the work process.
Learn more about Scatter Plot 
Cycle Time Scatter Plot
Additionally, you can also use the Cycle Time Histogram to see your work tasks' most common cycle time length. This chart will help you monitor and control the desired pace of your team.
Learn more about Cycle Time Histogram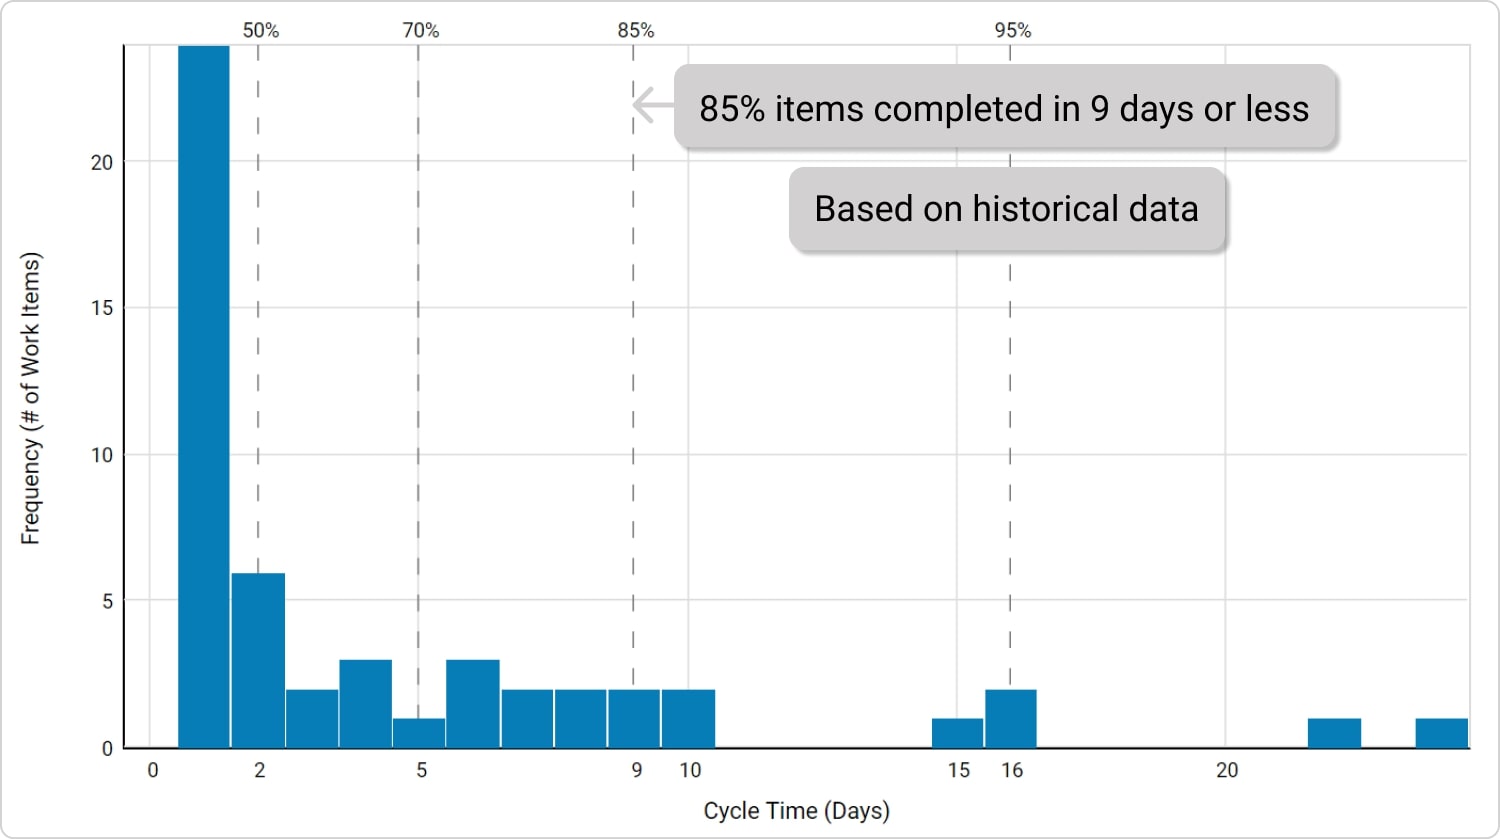
Cycle Time Histogram
Throughput
Throughput is the number of tasks finished per time unit. For example, completed work items per day. Throughput can be named a team productivity metric. It represents the productivity level of your team in the past.
The throughput is an important metric to track because it shows you the impact of your workflow on the total business performance. The overview of total processed units can help you make important business decisions, such as to expand work capacity, to speed up production, and so on.
However, throughput can be a tricky metric. It shows you the number of tasks that have been finished per day, but it doesn’t show you when different tasks were started. This is why, for more precise future decisions, you can combine the throughput metrics with cycle time and lead time reporting.
How to measure Throughput?
You can use the Throughput Histogram to see the average throughput per day or what percentage of all days had a certain throughput. It will give you a better understanding of your team’s capacity.
Learn more about Throughput Histogram

Throughput Histogram
Work in Progress
Unfinished work cannot deliver value to your customers. However, “Work in Progress” plays a crucial role in monitoring and analyzing your workflow’s capacity. This is why it is important to track work items that are in progress but not finished yet. By doing so, not only can you determine your team’s capacity, but you can also improve the value flow.
You can easily monitor work in progress on your Kanban board. The board shows you a quick overview of all tasks that are in progress and vital information related to each task, such as assignee, deadline, description, and so on.
How to measure Work in Progress?
Furthermore, by using an Aging Work in Progress chart, you can see the sum of all work items that are being processed and how much time has passed since they were started. This way, you can spot tasks that have been in progress for too long and why.
Learn more about Aging Work in Progress
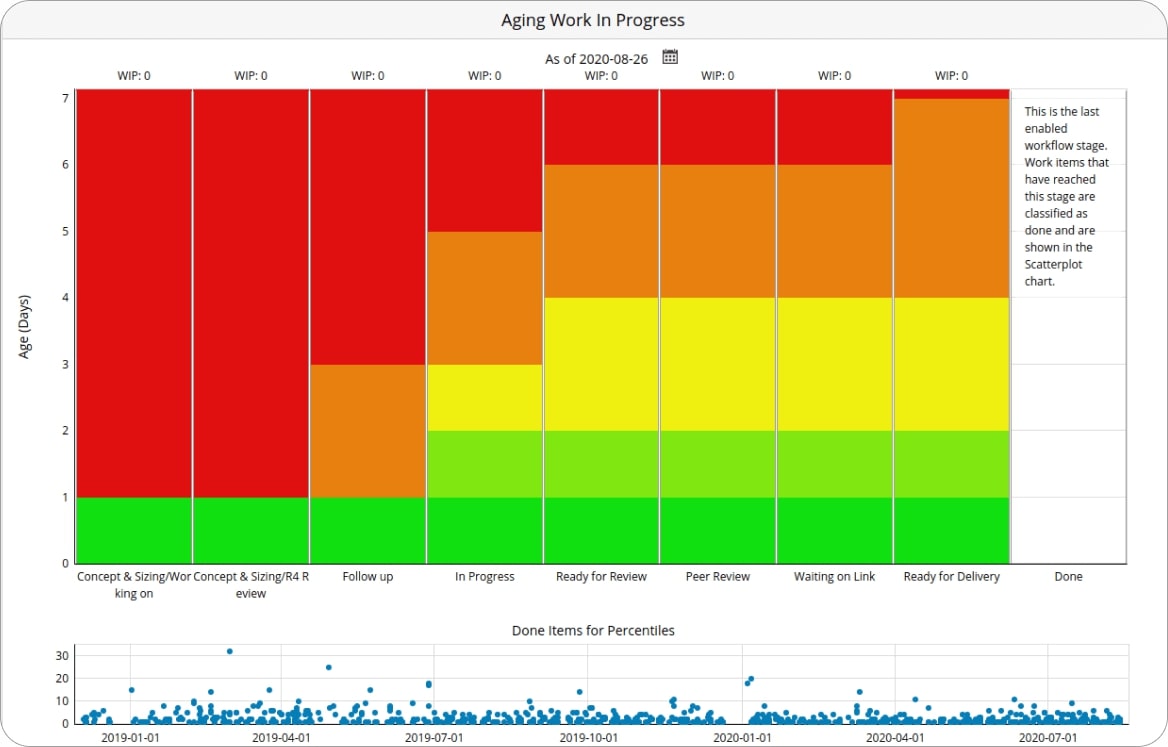
Aging Work in Progress
Queues (The Cost of Waiting)
Queues appear in your workflow while tasks await further action. For example, a queue stage can be ”waiting for review”. Often queues accumulate a major part of tasks’ cycle time because work items are interrelated, and they depend on different team members. This is why it is important to track queues and understand how they can impact your overall performance. It is reasonable to limit the number of work items in queues and try to move them as fast as possible.
In Lean, waiting is considered a major waste. Therefore, the longer tasks spend in queues, the higher the costs.
How to track and analyze Queues?
You can use the Heat Map to monitor and analyze queues. This tool actually shows how long your tasks have in each stage of your workflow. This way, you can see the total amount of time work items in queues reside a predefined time frame.
When Will It Be Done?
Wouldn’t it be great if your business can answer this question with certainty? Of course, it would. Work estimation has always been a problem, but with Kanban metrics, you can use data-based forecasts to see when your tasks will be completed.
Meet Monte Carlo simulations - a statistical tool that can help you make data-driven decisions.
Based on your workflow’s historical data, this tool runs through a large number of random simulations to give you a probabilistic forecast of when current tasks can be finished or how many tasks can be completed for a certain period of time.
Learn more about Monte Carlo simulations

Monte Carlo Simulations
These are some of the most important Kanban metrics you can start with to make your team more productive and your workflow more efficient.
If you are hungry for more information, check out our dedicated articles.
We offer the most flexible software platform
for outcome-driven enterprise agility.