Histograms are among the most adored ways to monitor key performance indicators and present data to stakeholders because of their simplicity and clarity. This is among the main reasons why the good old Cycle Time Histogram remains among the most widely-adopted Lean management charts.
If you have been practicing project management for a while, you probably know that metrics vary, and there are plenty of ways and tools to measure them.
However, a significant part of them is difficult to understand. Even though you eventually learn how to make the most of them, presenting data to external stakeholders remains a hurdle.
With the help of visual histograms, you can track basic information about the dataset, such as the median value, the width of spread, and the overall distribution of the assignments that are being displayed.
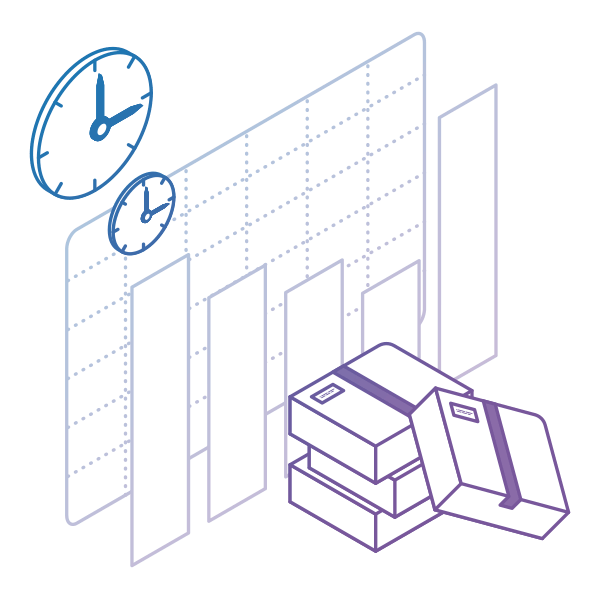
Histogram for Measuring Cycle Time
Cycle time is one of the three most important metrics in Lean management. Therefore, measuring and improving it is crucial for the successful implementation of Kanban. You can find much-advanced analytics for monitoring cycle time on a Kanban board like the cycle time scatter plot.
Without a doubt, they are powerful and can help you improve how fast cards are passing through your Kanban board, but this doesn’t change the fact that they are difficult to understand at first sight. When comparing a histogram for measuring cycle time to an advanced chart, the greatest advantage that comes to mind is the simplicity of the histogram.
 The horizontal axis of a typical cycle time histogram visualizes the different cycle time values of all the Kanban cards that were on your Kanban board during a predefined time frame.
The vertical axis shows the frequency of the cycle time that work items on your board share. Each column on the chart serves as a bin containing the number of Kanban cards with the same cycle time. Their height depends on the number of tasks that fall into it.
For example, if most tasks on your Kanban board had a cycle time of 3 days, the bin representing this value will be the highest one on your histogram.
Benefits of Using a Cycle Time Histogram
Since a growing number of teams are working remotely now, digital Kanban software solutions that come with cycle time histograms built-in have gained popularity.
One of their greatest benefits is that digital cycle time histograms can be accessed from any point of the globe with an internet connection. This makes them especially useful for distributed teams.
Digital histograms come with side perks that can help you find precisely the information you wish to visualize. For example, you can filter the cycle time of tasks on your Kanban board by:
- Assignee
- Type of assignment
- Priority
After filtering and visualizing the data of interest, you can export the results in a .png format to share with external people.
As a leader practicing Lean management, you’ve got the responsibility to get rid of as many waste-generating activities as possible. Staring at a complex chart and trying to understand what it’s trying to show you can easily be categorized as waste.
This is why a histogram for tracking cycle time can prove to be handy to any manager who seeks simplicity and transparency. The histogram is a great way to visualize data and present it to your team and external stakeholders alike.
Thanks to the concise and transparent view that a cycle time histogram provides, you won’t have to spend a long time explaining how the chart works and what the data inside shows.
Even better, you won’t have to answer unnecessary questions during your presentation or doubt whether everyone understands what you are showing them.
We offer the most flexible software platform
for outcome-driven enterprise agility.
In Summary
It is fair to say that the histogram is one of the charts that have passed the test of time. Using a Cycle Time Histogram lets you:
- Track the cycle time of cards on your Kanban board
- Present data to stakeholders in a way that is easy to understand
- Clearly display assignments that are taking longer than usual to complete


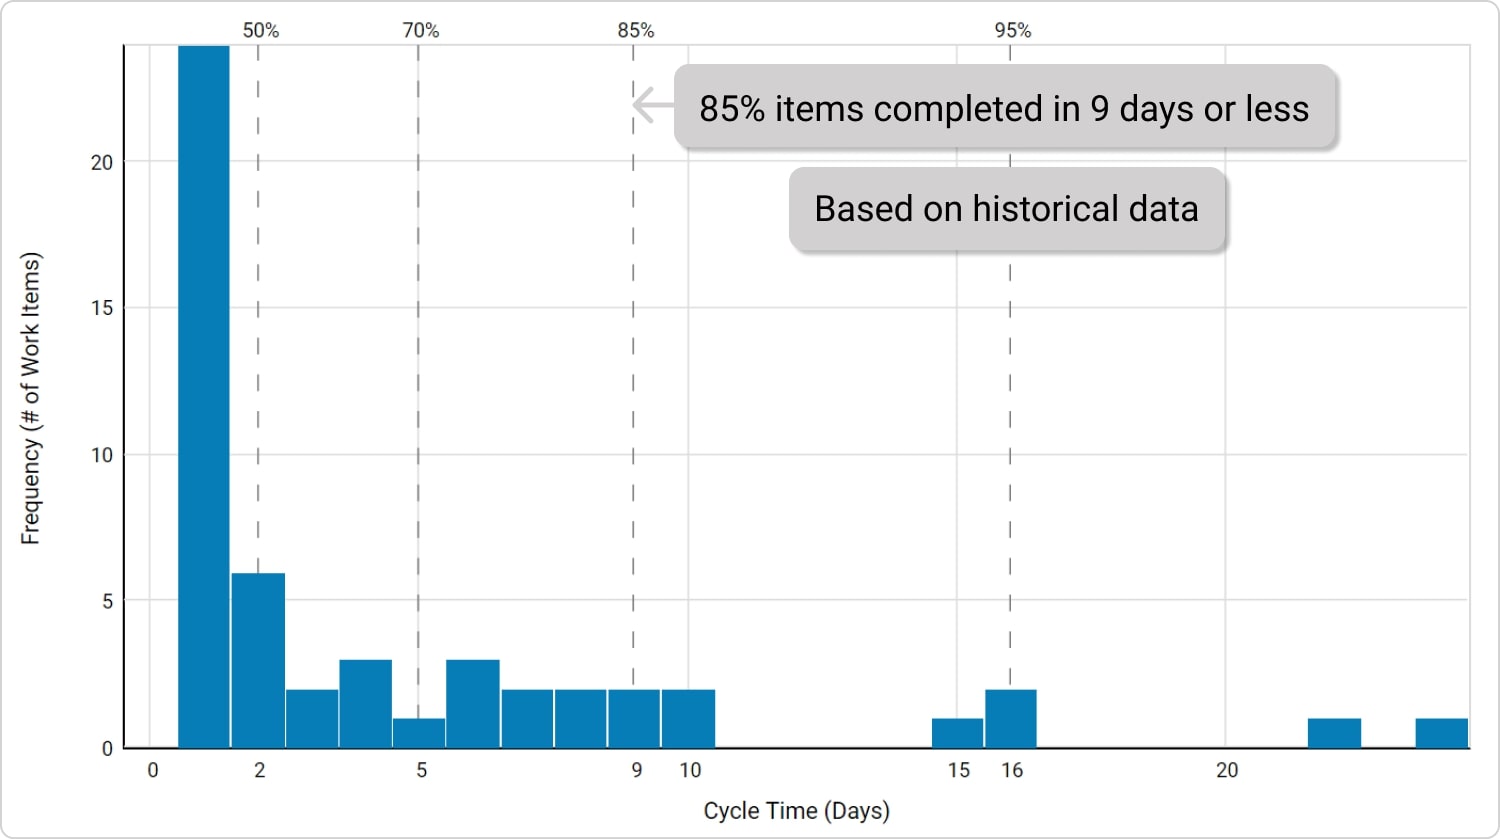 The horizontal axis of a typical cycle time histogram visualizes the different cycle time values of all the Kanban cards that were on your Kanban board during a predefined time frame.